


A company I advised was reporting fifteen marketing KPIs in a monthly review. When I asked which numbers had changed a decision in the last quarter, the answer was zero. They were measuring everything and deciding nothing.
That gap, between having data and knowing what to do with it, is the most expensive problem in digital marketing analytics today. It is also the most under-discussed. Demonstrating the impact of marketing actions on financial outcomes is now the top challenge for 64% of marketing leaders, and the pressure has climbed sharply over the past two years from CEOs (51% to 61%), Boards (33% to 50%), and CFOs (52% to 63%) (The CMO Survey, Spring 2025). Only 52% of senior marketing leaders say they can prove marketing’s value at all (Gartner, Sep 2024).
I see the same pattern in my own data. In my APAC AI Adoption survey of founders across the region, content and marketing was the single most common place they apply AI, named by 77%. Yet while 73% report time savings from AI, only 18% can point to an increase in revenue. That gap between activity and outcome shows up at every size of company, the moment any team starts measuring.
The standard advice is to track more metrics. The standard advice is wrong. This article introduces the Marketing Clarity Loop (MCL), a decision-first measurement framework I created that flips the order. You start with the decisions you actually make, then connect the minimum data to inform them, and use AI to interpret the signal into a weekly action brief. Then I will show you how to build it as a live marketing dashboard, the one I run for my own agency, that refreshes daily and writes its own recommendations with Claude Cowork.
Key Takeaways
- 64% of marketing leaders cite “proving marketing’s impact on financial outcomes” as their top challenge (The CMO Survey, 2025).
- The Marketing Clarity Loop (MCL) is a decision-first framework I created. Its five steps spell CLEAR: Choose, Link, Establish, Analyse, Respond.
- AI referrals to top websites grew 357% year-on-year to 1.13 billion visits in June 2025, but most of that traffic is invisible in default GA4.
- The live version runs on Claude Cowork: a daily routine pulls GA4, Search Console, social, email, and ad-platform data through MCPs and writes recommendations straight into the dashboard.
New frameworks and build logs, like this one, go out in my newsletter first. Subscribe here.
What Is the Marketing Clarity Loop?
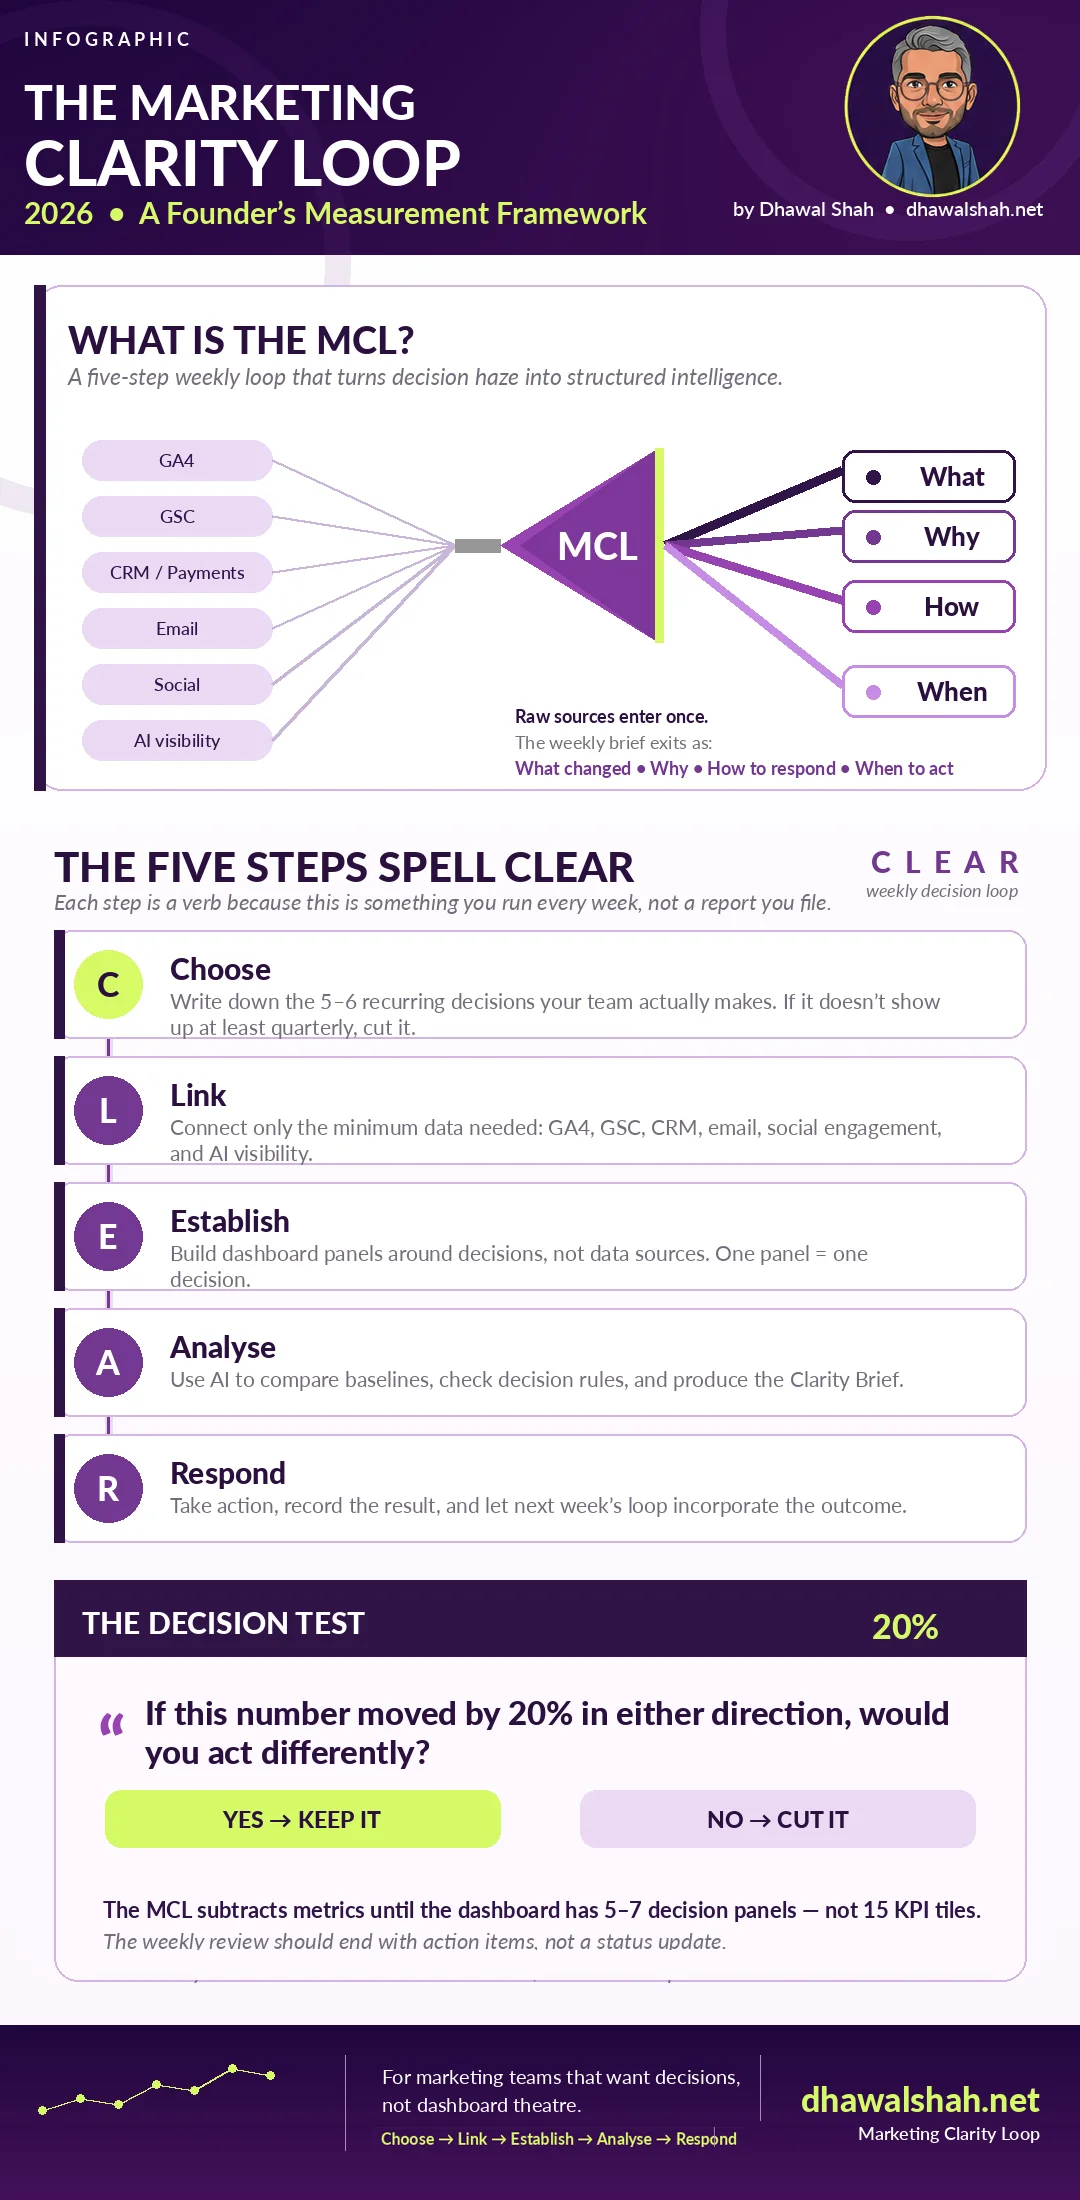
The Marketing Clarity Loop (MCL) is a five-step measurement framework I created and run inside my own agency, developed from doing the work rather than adapted from a textbook. It starts with the decisions a marketing team makes recurrently, connects the minimum data needed to inform each one, and uses AI to interpret that data into a weekly structured brief. The five steps spell CLEAR: Choose the decisions, Link the data, Establish the dashboard, Analyse the signal, and Respond and refine. The loop runs continuously, with each cycle refining the next.
Most analytics frameworks start with metrics. The MCL starts with decisions, the same instinct behind pushing data-driven decisions down to the teams closest to the work. That single inversion changes which numbers go on the dashboard, which numbers come off, and how the weekly review meeting feels.
The Five Steps Spell CLEAR
The five steps spell CLEAR: Choose, Link, Establish, Analyse, Respond. Each one is a verb, because the loop is something you run every week, not a report you file.
Choose the Decisions
Write down the five or six recurring decisions your team actually makes. Not aspirational ones. Real ones. Examples: which channel should I scale or kill this month, where is the funnel leaking right now, what content should I create next, is CAC sustainable at current spend, are the right people converting, what is the AI-driven traffic trend. The list should be short. If a decision doesn’t show up at least once a quarter, cut it.
Link the Data
For each decision, list the minimum data sources needed to inform it. GA4 for traffic and conversions. Google Search Console for rankings and AI Overview appearances. Your CRM or payment processor for revenue, CAC, LTV. Your email platform for subscriber growth and reply rate. Social only for engagement rate, never for follower count. AI visibility tools for brand mentions in LLM responses. Connect what you need. Skip what you don’t.
Establish the Dashboard
Build a dashboard where each panel maps to a decision, not a data source. This is the structural shift. A panel called “Channel Decision” shows the three numbers needed to choose to scale or kill a channel. A panel called “Funnel Decision” shows where the biggest drop-off sits this week. Looker Studio is the easiest free place to build this, but the tool matters less than the rule that one panel equals one decision.
Analyse the Signal
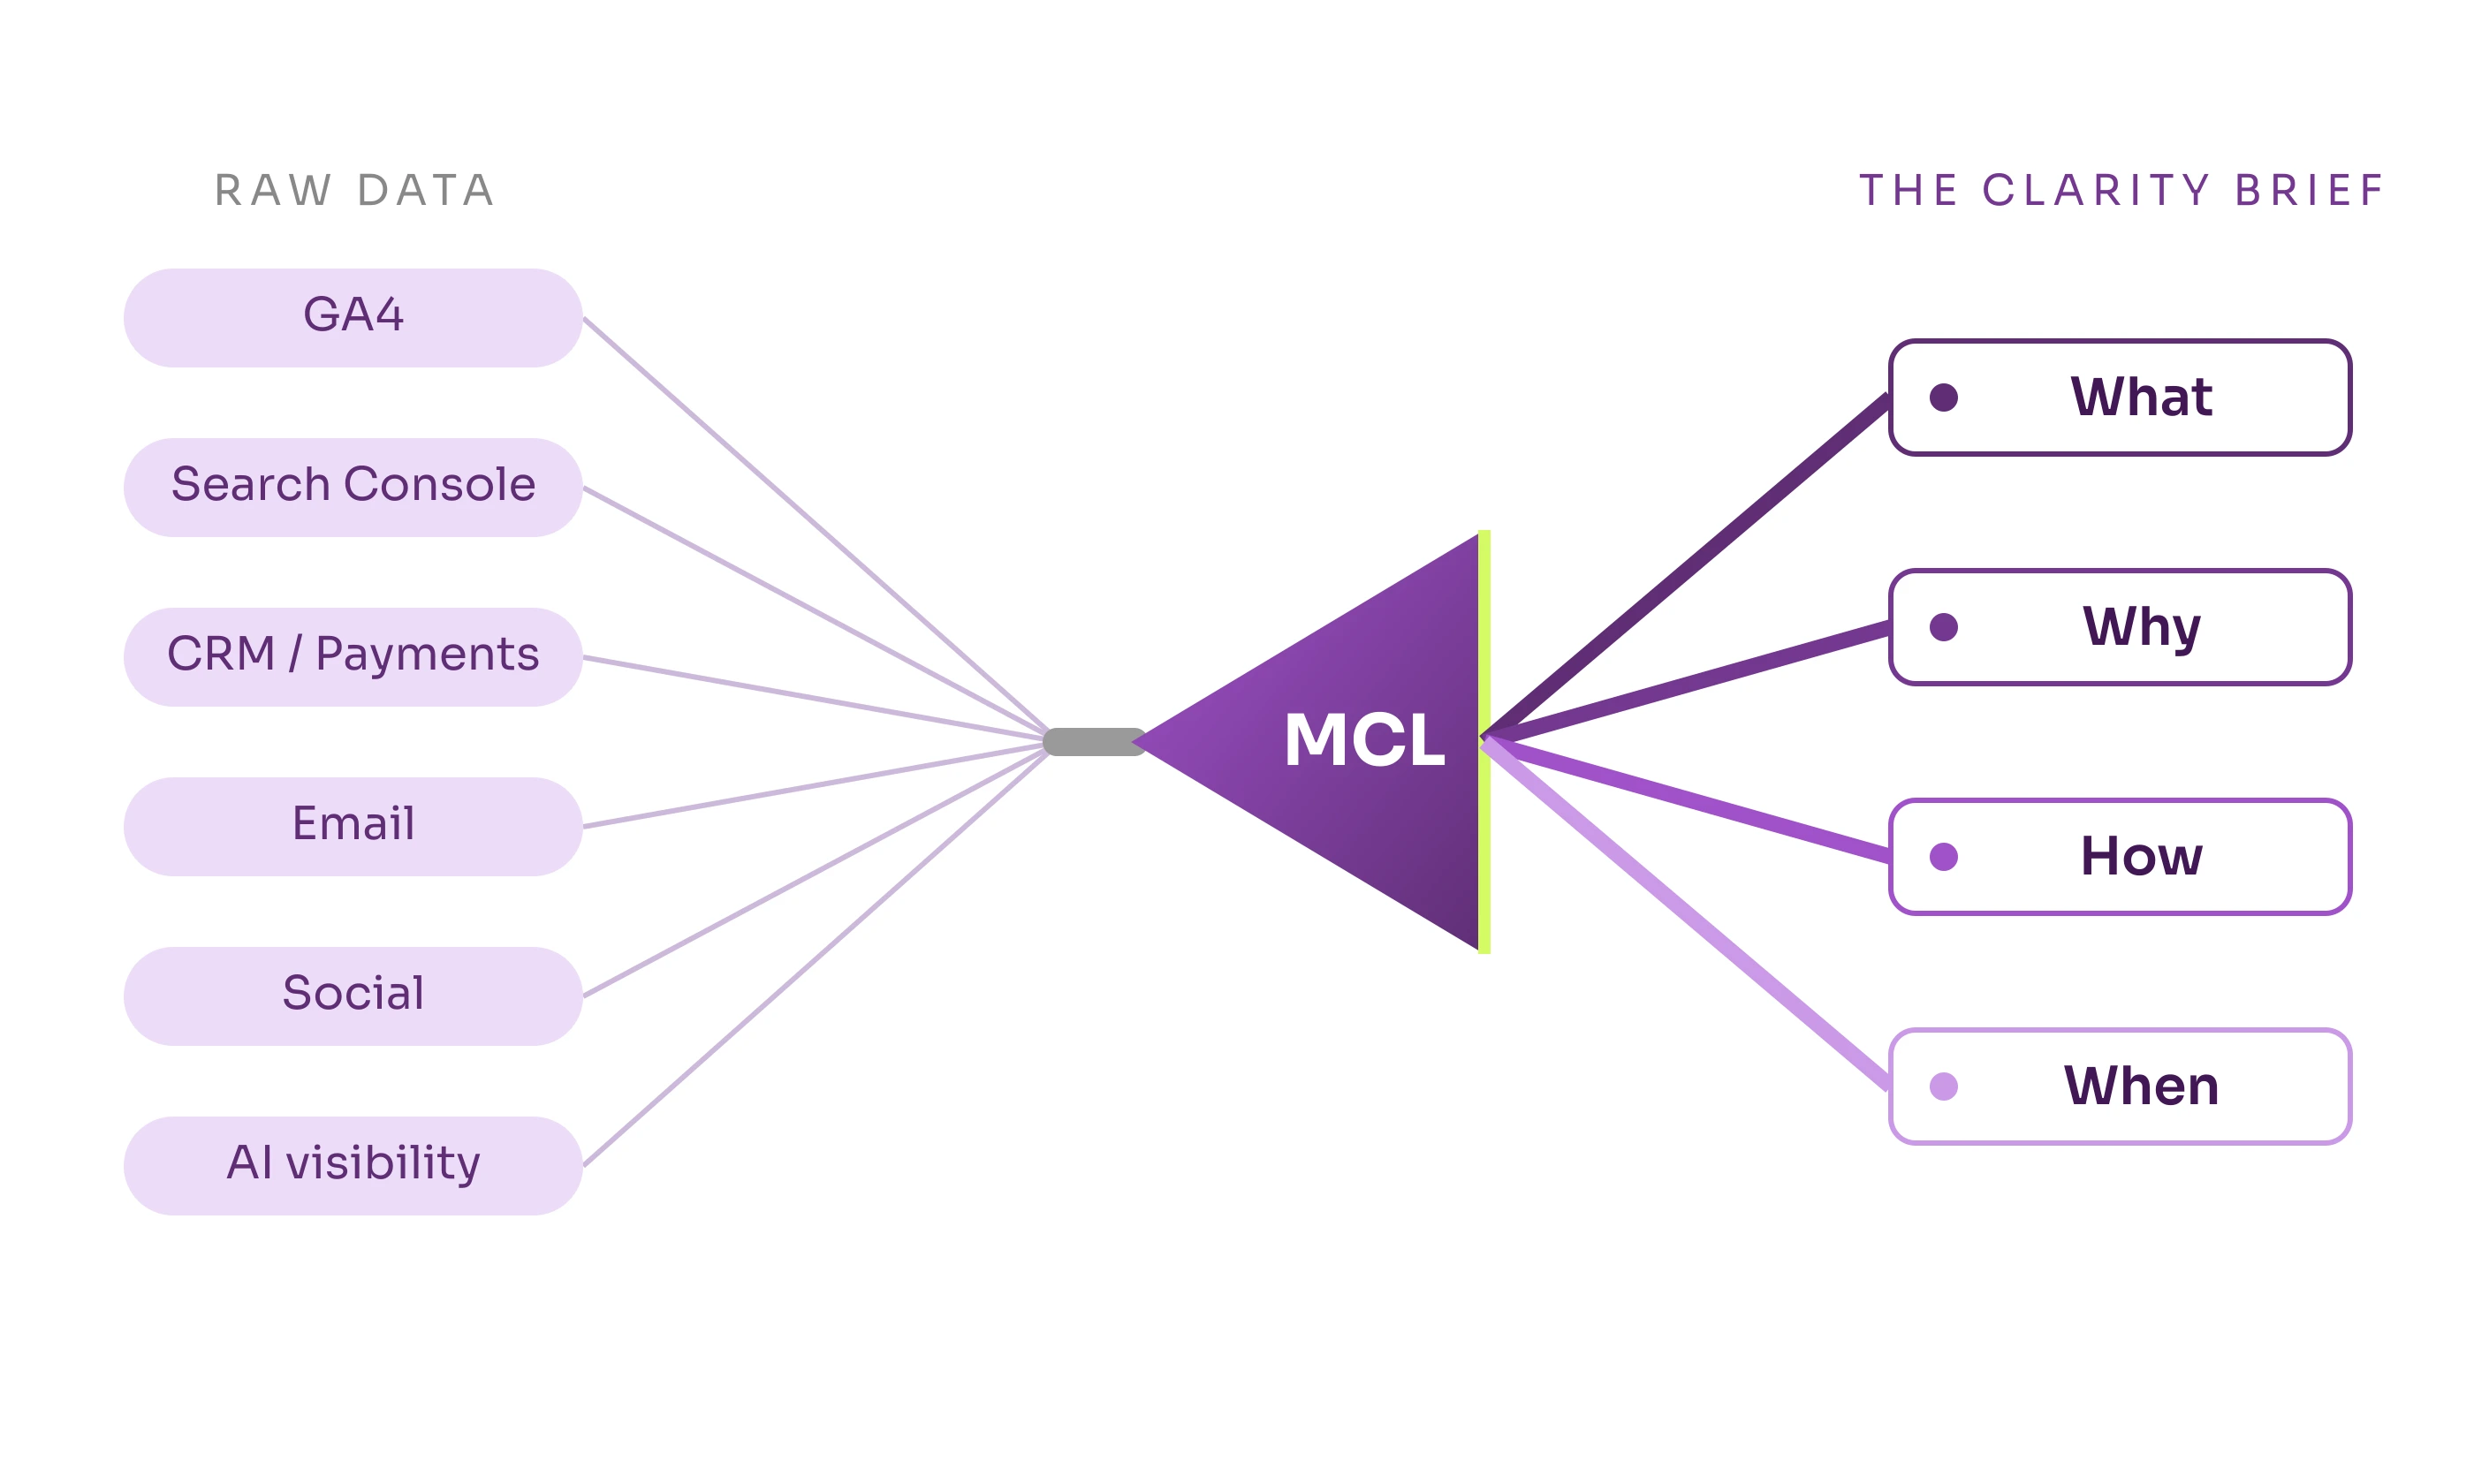
This is where AI changes the game. Claude runs on a schedule, pulls data from the connected sources via MCPs, compares to baselines, checks pre-defined decision rules, and produces a structured brief. I call it the Clarity Brief, and every recommendation in it answers four questions: What changed, Why it changed, How to respond, and When to act.
Respond and Refine
Take the action. Record the result. Next week’s cycle incorporates the outcome. Decisions that get resolved get replaced. The loop doesn’t stop, because marketing decisions never stop.
The Decision Test
The decision test is the single rule that decides whether a metric stays on your dashboard: if this number moved by 20% in either direction, would you act differently? If yes, keep it. If no, cut it.
This rule is what separates the MCL from every “top KPIs to track” listicle. The default mode in marketing analytics is to add metrics. The MCL subtracts them. The result is a dashboard with five to seven decision panels instead of fifteen tile-based KPI widgets, and a team that walks out of the weekly review with action items instead of a status update.
At 2Stallions, my agency across Singapore, Malaysia, Indonesia, and India, I run this on our own marketing and our high-level business decisions, not on client reporting. The biggest behavioural shift is in the weekly meeting. It used to open with “here’s what happened last week.” It now opens with “here are this week’s three decisions and what the data says about them.” The meeting takes twenty minutes instead of an hour, and people leave with assignments.
Two Operating Modes
Mode A is human-only. You run the dashboard, read it weekly, interpret it yourself, act. This works for any team today. No AI required.
Mode B adds the Clarity Brief. The dashboard stays. Claude Cowork runs on a schedule, applies the decision rules, and writes a structured brief with confidence tags into the dashboard. The human still approves every recommendation. Same framework, same metrics, different interpreter.
Most teams should start with Mode A and earn their way to Mode B once the dashboard discipline holds.
| Mode A (human-only) | Mode B (AI-assisted) | |
|---|---|---|
| Who interprets | You, weekly | Claude Cowork, on a schedule |
| Data pulled | By hand | Automatically through MCPs |
| Output | Your read of the dashboard | The Clarity Brief: What, Why, How, When, with confidence tags |
| Human role | Read and act | Approve, override, or defer |
| Requirement | None, works today | MCP connections and decision rules |
Does Decision-First Analytics Survive AI?
It is a fair question. If an AI can pull every source and analyse everything in seconds, why ration metrics at all? Collect it all and let the machine sort it out.
The opposite is true. AI lowers the cost of collecting and processing data to almost nothing, which moves the bottleneck entirely onto judgement: which decisions matter, and what a good one looks like. Point a capable model at a vague question and it will produce confident, well-written analysis of the wrong thing, faster than a human ever could. The CMOs in Adverity’s 2025 survey estimate that 45% of the data they use to drive decisions is incomplete, inaccurate, or outdated, and not one of them believed their decision data was more than 75% complete (Adverity, 2025). Automation doesn’t fix that. It scales it.
So the loop holds, but the weight shifts. AI collapses the middle, steps two through four, the gathering and the first-pass reading. The human work concentrates at the ends: choosing the decisions at the start, and acting on the brief at the end. Most teams have it backwards, spending their hours in the middle that machines now do best. The proof that few have made the shift is in the adoption gap: 76% of marketers now use AI, but only 13% have moved to agentic AI that actually does the work (Salesforce, Feb 2026). Decision-first is how you join that 13% without drowning in output.
What Should You Stop Tracking?
Removing a metric from your dashboard is as valuable as adding one. Marketers use just 33% of their martech stack capability on average, and the same overload pattern shows up in dashboard design: too many tiles, too little signal (Gartner via MarTech, 2023). Every metric costs attention. If a metric doesn’t connect to a decision, it’s noise dressed as data.
Apply the decision test ruthlessly. The metrics most likely to fail it are the ones marketing teams have been trained to report on for the last decade.
| Metric | Why It Fails the Decision Test |
|---|---|
| Raw pageviews | High pageviews with low engagement is worse than low pageviews with high conversion. The number alone can’t drive a decision. |
| Bounce rate | Officially deprecated in GA4 and replaced with engagement rate. Still showing up on dashboards built in 2019. Cut it. |
| Social follower count | Vanity. Engagement rate per post is the actionable cousin. Follower count moves slowly and tells you nothing about reach. |
| Email open rate | Unreliable since iOS 15 changed how Apple Mail handles tracking pixels. Reply rate and click-through tell you what’s actually working. |
| Ad impressions without click context | A million impressions with zero clicks is a waste. Pair impressions with click-through rate or drop them. |
| Rankings for non-converting keywords | Rank tracking on terms that never produced a customer is a status game, not a marketing decision. |
| Time on page without scroll depth | Long time-on-page can mean engagement or it can mean someone left the tab open. Without scroll depth, you can’t tell. |
Removing a familiar metric meets resistance, especially one a team has reported for years. Bounce rate is the classic case. Replace it with engagement rate plus scroll depth on your top landing pages, and show how those numbers shift decisions about which pages to rewrite. The dashboard gets smaller. The decisions get faster.
The trust signal in this section isn’t what you tell people to track. It’s what you tell them to remove.
How Do You Track AI Traffic in Google Analytics?
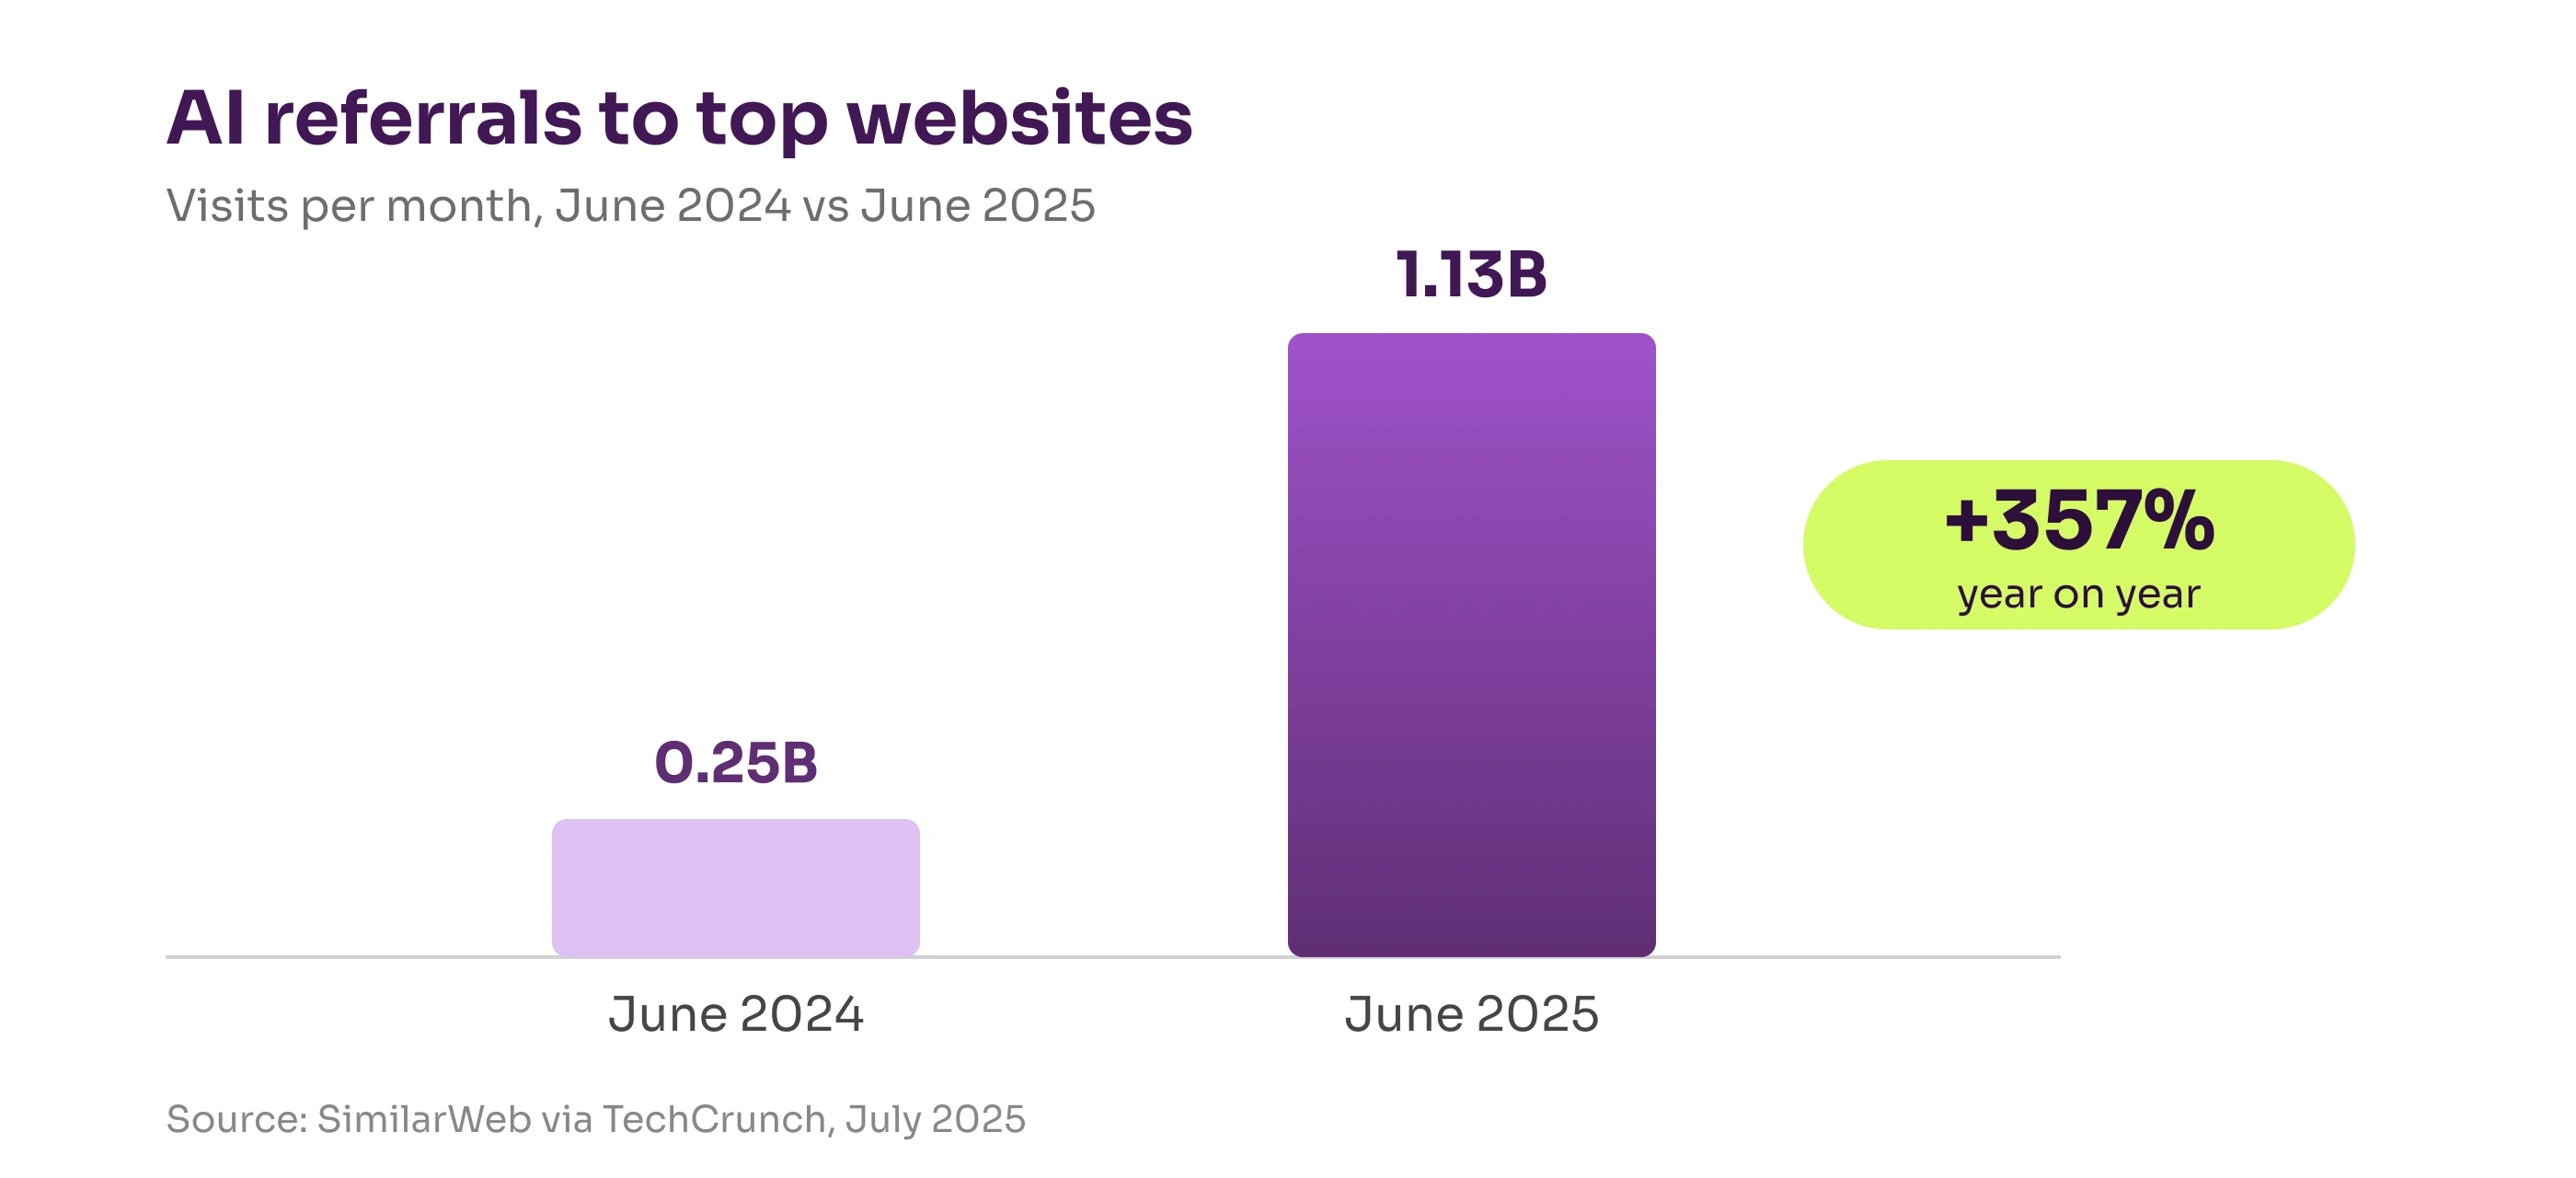
AI search engines are sending traffic to your site right now. Most GA4 setups don’t show it as AI traffic. Default GA4 channel groupings bury ChatGPT, Perplexity, Claude, and Copilot visits in “Direct” (when there is no referrer header, often a brand mention someone acted on without clicking a link) or “Referral” (when the AI tool does pass referrer data). Neither bucket is labelled as AI. The fix is a custom channel grouping that matches the AI source domains, which pulls the visits that do carry a referrer into a clean AI channel. The unlinked mentions that arrive with no referrer stay in Direct, and sizing that share takes attribution modelling against past data rather than a channel grouping. AI referrals to top websites grew 357% year-on-year to 1.13 billion visits in June 2025 (SimilarWeb via TechCrunch, Jul 2025).
ChatGPT alone accounts for roughly 87.4% of AI referral traffic across major industries, with Perplexity growing 370% year-on-year to 30 million daily queries (SimilarWeb, 2025). If you can’t see this traffic in your dashboard, you can’t make decisions about the content driving it.
Setting Up the AI Channel in GA4
In GA4, go to Admin > Data Display > Channel Groups and create a new custom channel grouping. Add an “AI Assistants” channel with these source matches:
chatgpt.com,chat.openai.comperplexity.ai,www.perplexity.aiclaude.aicopilot.microsoft.comgemini.google.com
Use a regex match on the source field to catch variants, since some AI sources show up inconsistently. This grouping is the first thing I wire into any marketing dashboard, because without it the fastest-growing channel stays invisible.
Why This Matters for Your Content Decisions
The AI metrics layer connects directly to two MCL decisions: “what content should I create next?” and “what’s the AI-driven traffic trend?” When you can see that a specific article got 34 Perplexity referrals last week for queries you didn’t know you ranked on, you have a content decision waiting to be made. Without the channel grouping, you have a blank space in your reporting.
For the strategy side of this, the shift to AI engine optimisation is the companion piece. The MCL is how you measure the result. Organic CTR on queries with AI Overviews has fallen 61%, which means citation in AI responses is becoming the new ranking signal (Seer Interactive, Sep 2025). You can’t fix what you can’t see.
How Do You Build a Marketing Dashboard?
To build a marketing dashboard, start with the decisions it has to inform, connect the minimum data for each, and give every panel one job. Build it in a tool like Looker Studio, read it weekly, and automate the data pulls once the structure holds. The decision-first version is the CLEAR loop above. Here it is as a short build sequence:
- List the five or six decisions the dashboard must inform.
- Map the minimum data source to each decision, and skip the rest.
- Build one panel per decision, not one panel per data source.
- Review it weekly and walk out with one to three decisions.
- Automate the pulls, and the first-pass read, once the structure is stable.
Most marketing dashboards fail because they start from the data that is easy to plug in rather than the decisions the team has to make. Reverse that order and the dashboard gets smaller and more useful at the same time. What belongs on it depends on your business model.
One Spine, Different Inputs by Business Model
A SaaS company and an e-commerce store should not track the same metrics. They can still run the same five-decision spine and swap the inputs. Here is how the decisions and data sources shift across four common business models.
| Business model | Decisions to map | Primary data sources |
|---|---|---|
| Service / Agency | Channel ROI, pipeline health, content lead source, AI traffic | GA4, GSC, CRM, email |
| SaaS / Subscription | Acquisition efficiency, activation health, churn signals, AI traffic | GA4, payment processor, product analytics, email |
| E-commerce | Channel ROAS, product performance, cart recovery, AI traffic | GA4, Shopify or platform, email, ad platforms |
| Content / Media | Content ROI, subscriber growth, citation performance, AI traffic | GA4, GSC, email, ad network |
The service row is the one I run for 2Stallions: the AI channel grouping, a funnel-leak panel, and content lead-source attribution. The content row is the dashboard behind dhawalshah.net, where the AI citation panels have been tested on a real content site. Whatever your model, build the smallest dashboard that answers your decisions, then automate the pulling and the reading. That second part is where Claude Cowork comes in.
How I Run This Live With Claude Cowork
Mode B stops being a diagram the moment you wire it to live data. Here is the version I actually run.
First, what Claude Cowork is, since the name does little to explain it. Most people meet Claude through a chat window. Cowork is the working side of the same model: an agentic workspace that connects to your tools through MCP (the Model Context Protocol, an open standard that lets an AI read from and act inside software like GA4, Search Console, or a CRM), runs multi-step jobs on a schedule, and builds and maintains its own artifacts. In my case the artifact is a dashboard. Ask a chatbot about your numbers and it waits for you to paste them in; Cowork goes and gets them, assembles the page, and keeps it current.
That distinction matters. The slow part of marketing analytics has always been gathering the data rather than interpreting it, and gathering is the part Cowork takes over. Salesforce puts the average marketing organisation at seven data sources to integrate for agentic marketing, and high-performing marketers who deploy AI agents reclaim around eight hours a week (Salesforce State of Marketing, Feb 2026). Seven sources is roughly my list.
The marketing numbers for 2Stallions sit in the Demand tab of a larger dashboard that covers the whole business, one tab per function. Keeping marketing on the same surface as the rest of the business is deliberate. A marketing number earns its place when you can read it next to revenue, not in a silo of its own.
The dashboard is an HTML page that Claude Cowork builds and keeps current. Today I open it locally. I am moving it to a cloud routine so it runs whether or not my laptop is on, which is the difference between a tool you remember to run and a tool that is simply always up to date.
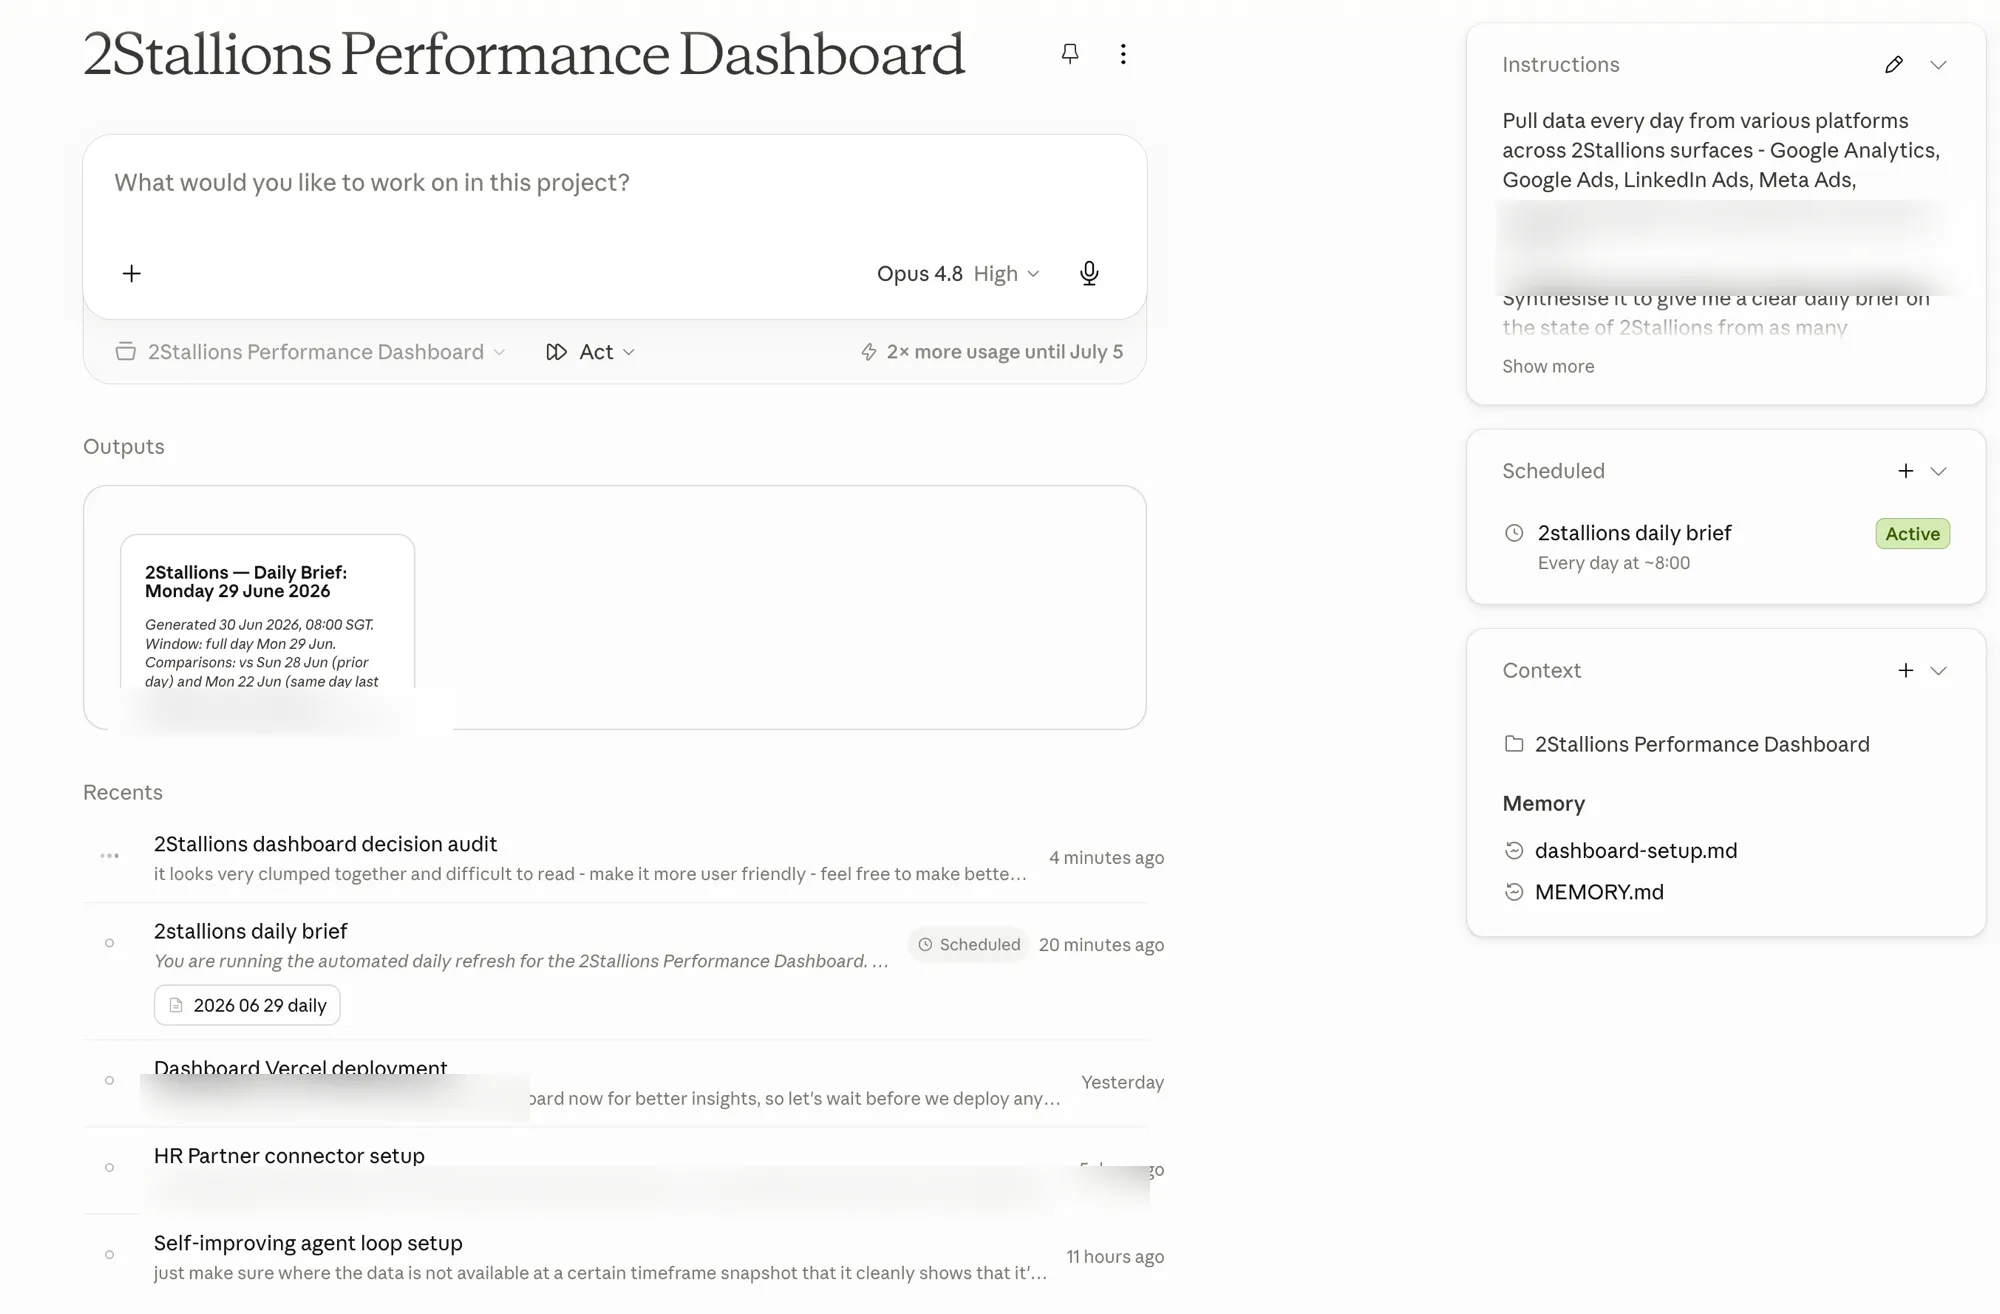
Cowork pulls from every source the Demand tab needs, each through its own MCP connection:
- Google Analytics and Search Console, through MCPs I built, for traffic, conversions, rankings, and the AI-referral channel above. The “AI Assistant” row in the channel table is that custom grouping, live.
- Social through SocialPilot’s MCP for reach and engagement per post. We use SocialPilot; Buffer or any tool with an MCP slots in the same way.
- Email and CRM through ActiveCampaign’s MCP for list growth, reply rate, and the leads entering the pipeline.
- Paid media through the Google Ads, LinkedIn Ads, and Meta Ads MCPs I built, so spend, CAC, and ROAS land beside the organic numbers instead of sitting in three separate ad managers.
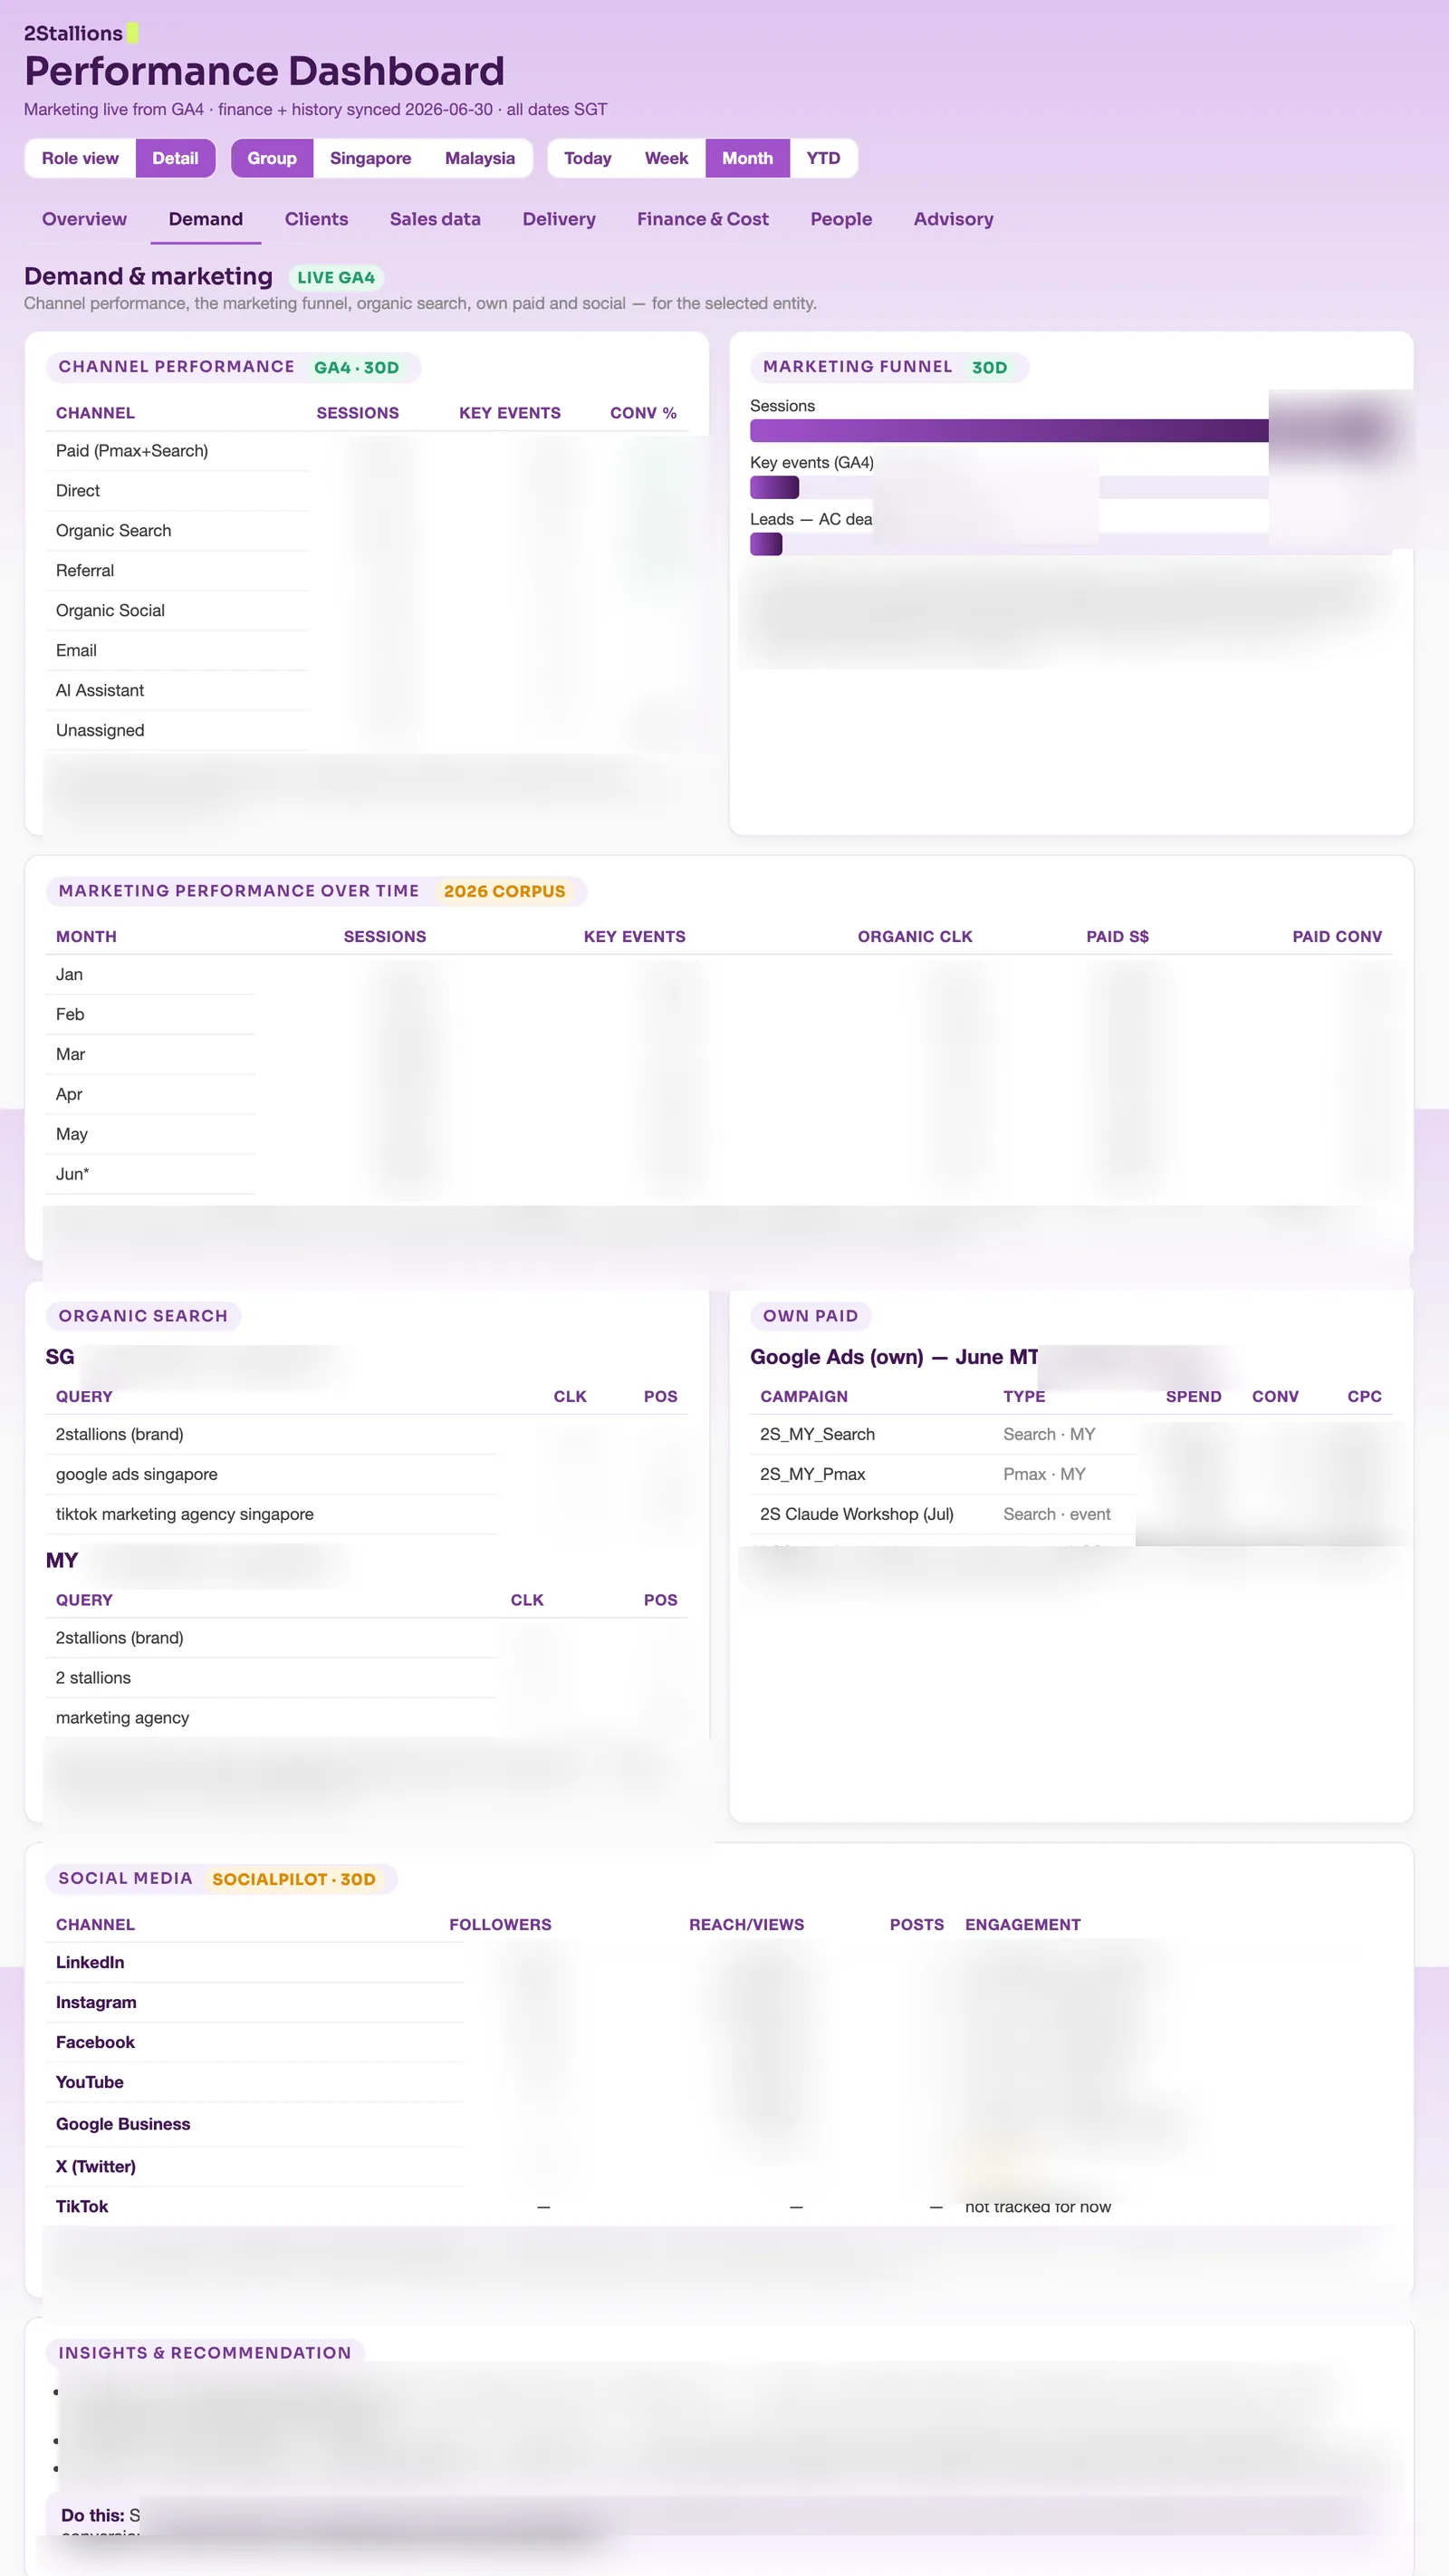
The routine runs daily. Each morning it pulls the latest numbers, compares them to the previous week and the four-week rolling average, applies the decision rules, and writes its findings into the Insights and Recommendation panel at the foot of the tab. That panel is the Clarity Brief made concrete: what changed, why, and a single “do this” line. Everything above it is the evidence behind the call.
This is where the Marketing Clarity Loop and the dashboard meet: the five CLEAR steps are literally what the routine does. Choose is the set of decisions the brief answers, Link is the MCP connections, Establish is the Demand tab, Analyse is the daily routine, and Respond is my Monday review, where I approve the recommendation or overrule it.
I look at it once a week. The daily cadence is not so I can stare at it every morning. It is so that when I open it on Monday the trends and the recommendation are already current, not a week stale. This is the practical answer to a question the framework raises: if you only act weekly, why collect daily? Because a brief assembled from Monday-only snapshots misses the shape of the week. Daily collection, weekly decision.
The guardrails I describe next are what keep this honest. The routine recommends. I approve, override, or defer. Nothing in the dashboard acts on its own.
Want the build logs behind systems like this? Join the newsletter for how I run AI across marketing and operations.
How Does the Clarity Brief Work?
The Clarity Brief is the structured weekly output of Mode B. Claude runs on a schedule, pulls live data from the configured sources via MCPs, compares the current week to the previous week and the four-week rolling average, applies pre-defined decision rules, and produces a brief where every recommendation answers four questions: What changed, Why it changed, How to respond, and When to act. Each recommendation carries a confidence tag and a structured approval block for the operator.
Three guardrails keep the brief honest. Without them, you get plausible-sounding nonsense at scale, which is worse than no brief at all. This isn’t a hypothetical risk. Gartner expects more than 40% of agentic AI projects to be scrapped by the end of 2027, citing escalating costs, unclear business value, and weak risk controls (Gartner, Jun 2025). A decision-first build with these three guardrails is how you avoid becoming one of them.
Guardrail 1: Confidence Tagging
Every recommendation gets one of three confidence tags. High confidence means strong signal, multiple weeks of consistent movement, multiple data points confirming. Medium means directional signal, single source, one week of movement. Low or Hypothesis means a pattern is suggested but the data isn’t strong enough to confirm causality. The skill prompt forces Claude to make this distinction explicit. A recommendation tagged Hypothesis is an invitation to investigate, not to act.
Guardrail 2: Decision Rules, Not Vibes
Pre-defined threshold rules go into a YAML config the routine reads before it writes anything. The AI checks rules first, then adds context. Rules are auditable and editable. Vibes aren’t.
decisions:
  channel_efficiency:
    rule: "Flag if CAC exceeds 3x the 4-week rolling average for 2+ consecutive weeks"
    action: "Recommend pausing or investigating that channel"
    urgency: "immediate"

  ai_traffic_growth:
    rule: "Flag if AI referral traffic grows >20% WoW for 3+ consecutive weeks"
    action: "Recommend creating follow-up content targeting cited queries"
    urgency: "this_week"

  activation_drop:
    rule: "Flag if activation rate drops below [user-defined threshold]"
    action: "Recommend 5 user interviews within 7 days"
    urgency: "immediate"
Edit the thresholds for your own context. The rules become your team’s operational handbook, version-controlled and updatable based on what gets approved versus overridden over time.
Guardrail 3: Human Approval Layer
Every Clarity Brief recommendation ends with a structured decision block:
Decision: Which content should I create next?
What: AI referral traffic up 34% WoW to the OpenClaw security article.
Why: Perplexity cited the article for 3 new queries this week, all security-related.
How: Write a follow-up covering the highest-volume cited query.
When: This week. Query momentum is active and will decay.
Confidence: High (3 weeks of consistent growth, multiple cited queries).
Recommended action: Publish follow-up article by Friday.
Status: [ ] Approved  [ ] Overridden  [ ] Deferred
The operator approves, overrides, or defers. The approval and override history becomes its own feedback signal. If a category of recommendation gets overridden 70% of the time, the underlying rule needs updating, not the AI.
Why the Human Stays in the Loop
The brief recommends. The operator decides. That separation is deliberate, and it is the design choice that makes the system trustworthy. AI is good at pattern detection across noisy data and bad at understanding the strategic context of a specific business in a specific quarter. The Clarity Brief plays to the first strength and stays out of the second. The same logic underpins how I think about building a data-driven culture at a startup: tools surface signal, humans make calls, the habit is the asset.
How to Run the MCL This Week
Pick five decisions you make recurrently. Write them down on a single page. For each one, list the two or three numbers you’d need to make that decision well. That’s your data source list, and it’s likely shorter than your current dashboard. Open Looker Studio, build five panels, one per decision, and put nothing else on the page. Pick a Monday morning slot. Spend twenty minutes a week reading it. That’s Mode A.
If you want the AI layer, connect your data sources to Claude Cowork through their MCPs, write your decision rules into a YAML file, and schedule the routine to run daily. Read the recommendations on Monday morning. Approve, override, or defer each one. Check the override pattern after a month and update the rules. That’s Mode B.
The hardest part isn’t the tooling. It’s the discipline of removing metrics. Every team I’ve worked with that built an MCL-style dashboard tried to add panels back within a fortnight. Resist it. The fewer numbers on the page, the faster the decisions.
Want a live dashboard like this for your own business? I help teams design and build decision-first marketing and business dashboards, wired to their own data. Get in touch and tell me what you're trying to decide.
Frequently Asked Questions
What is digital marketing analytics?
Digital marketing analytics is the practice of collecting and interpreting data from your marketing channels, including web, search, social, email, and paid ads, to make better decisions. The Marketing Clarity Loop reframes it as decision-first: you start with the decisions you actually make, then connect the minimum data needed to inform each one.
What are the four types of marketing analytics?
The four types are descriptive (what happened), diagnostic (why it happened), predictive (what will happen), and prescriptive (what to do next). Most marketing dashboards stop at descriptive. A decision-first approach pushes towards prescriptive, where the data points to a specific action rather than just a trend.
How do you build a marketing dashboard?
Start with the decisions the dashboard must inform, map the minimum data source to each, and build one panel per decision rather than one per data source. Looker Studio is a good free option. Review it weekly, and once the structure is stable, automate the data pulls. The decision-first version is the CLEAR loop: Choose, Link, Establish, Analyse, Respond.
Can AI build a marketing dashboard?
Yes. With Claude Cowork connected to your tools through MCP, AI can pull the data, build the dashboard, and refresh it on a schedule, then write recommendations into it. I run a live marketing dashboard this way: it updates daily and flags the week’s decisions, while I approve or override each one.
What are the most important digital marketing metrics for small businesses?
The most important metrics are the ones connected to decisions you actually make. For most SMEs, that reduces to customer acquisition cost, lifetime value, and the ratio between them. Add AI referral traffic if you publish content. The Marketing Clarity Loop starts with your decisions and works backward to the minimum metrics, rather than starting with a generic KPI list.
How do you track AI-driven traffic in Google Analytics?
Create a custom channel grouping in GA4 that catches referrals from chatgpt.com, chat.openai.com, perplexity.ai, claude.ai, and other AI sources. Default GA4 classifies most of this traffic as Direct (no referrer, or an unlinked brand mention) or Referral, making it invisible as AI. AI referrals grew 357% year-on-year to 1.13 billion visits by June 2025, so the gap is large and growing (SimilarWeb via TechCrunch, Jul 2025).
What's the difference between vanity metrics and actionable metrics?
Apply the decision test: if this number changed by 20%, would I do something different? If the answer is no, it’s vanity. Social followers, email opens since iOS 15, and raw pageviews are common examples. An actionable metric tells you what to do next: if activation rate drops, you investigate onboarding. If CAC rises on a channel, you cut or fix it.
Can the Marketing Clarity Loop work without AI?
Yes. Mode A is human-only: build the dashboard in a tool like Looker Studio and interpret the data yourself in a weekly twenty-minute review. Mode B adds the Clarity Brief, where Claude Cowork runs on a schedule, applies your decision rules, and writes a What/Why/How/When recommendation set with confidence tags into the dashboard. Same framework, same metrics. The AI layer is an upgrade, not a requirement.
How often should I review my marketing dashboard?
Weekly, on the same day, for thirty minutes maximum. Daily checking is almost always a waste of attention for SMEs because the data doesn’t move fast enough for daily action. Pick Monday morning. Walk out with one to three decisions. If you’re running Mode B, the Clarity Brief arrives on the same cadence and you spend the time approving recommendations rather than interpreting trends.
If the Marketing Clarity Loop is useful, subscribe for the frameworks and build logs I publish for operators.