


In June 2026 I published a survey of founders and operators across Asia-Pacific, asking what they had actually done with AI and what it returned. When the results came in I did the sensible thing and went looking for published regional data to check them against.
I couldn’t make the published data agree with itself, let alone with mine.
Vietnam was the clearest case. One report put business AI adoption at 18%. The other put it at eight in ten. Not 18 against 25. Eighteen against eighty. Both are current, still in circulation, and from institutions I would happily cite in a board pack (AWS and Strand Partners, 2025; UOB, 2026).
So I stopped writing and started reading. Every major Southeast Asian business AI survey published since mid-2025, the full country reports rather than the press releases, methodology sections and all. It took a fortnight, and it was worth it, because the answer turned out to be more interesting than sloppy research.
Nobody is wrong. They are answering different questions, and the question never makes it into the headline.
Key takeaways
- Vietnam’s business AI adoption is published as 18% (AWS and Strand Partners, measured against Vietnam’s 940,000 active enterprises) and as eight in ten (UOB, medium and large enterprises only). Both are accurate for their sample.
- Even one survey run identically in six markets is not comparable across them, because its denominator ranges from Singapore’s 345,100 enterprises to Indonesia’s 65 million.
- Breadth is contested. Depth is not. Five of six markets put 8% to 10% of adopters at a transformative level of use, and McKinsey independently puts 8% of regional enterprises at fully scaled AI (McKinsey and Singapore EDB, February 2026).
- My own survey found the outcome version of the same gap: among respondents who actually use AI, 87% report time savings and 21% report a revenue increase.
- The most-shared AI adoption ranking in the world measures people, not companies. On population data Vietnam ranks second in the region. On business data it ranks last.
What changed
- 6 August 2026. First published. Business figures read from the full AWS and Strand Partners country reports for all six markets (2025 set, plus Thailand’s 2026 edition), AWS Singapore’s May 2026 sector study, UOB Business Outlook H1 2026 and McKinsey with Singapore EDB (February 2026). Population figures current to Microsoft AI Diffusion Q1 2026.
An AI adoption rate is the share of a defined population doing a defined thing with AI over a defined period. Change any one of those three and the number moves, often by tens of points. Two accurate reports about the same country in the same year can differ four-fold without either one being wrong.
This page is maintained rather than shipped and forgotten: when a new report lands it goes into the tables below and gets a dated line in the block above. For related work on AI governance and board oversight, see the Leadership and Governance topic hub.
How many Southeast Asian businesses actually use AI?
Between 18% and 48%, depending on the market, on the one instrument that was run identically across all six.
That instrument is the closest thing the region has to a controlled experiment. AWS commissioned Strand Partners to field the same survey in every major Southeast Asian market: a thousand business leaders and a thousand nationally representative members of the public per country, weighted, following UK Market Research Society and ESOMAR guidance. The same questionnaire in the same year, with one published definition of what counts as adoption.
Share of businesses consistently using at least one AI tool, 2025 report set.
| Market | 2024 | 2025 | Growth | AI-adopting firms |
|---|---|---|---|---|
| Singapore | 40% | 48% | +20% | ~170,000 |
| Thailand | 24% | 32% | +33% | >600,000 |
| Indonesia | 19% | 28% | +47% | >18 million |
| Malaysia | 20% | 27% | +35% | 2.4 million |
| Philippines | 14% | 21% | +50% | >250,000 |
| Vietnam | 13% | 18% | +39% | ~170,000 |
All figures from AWS and Strand Partners, Unlocking [Country]‘s AI Potential 2025, at unlockingaispotential2025.com.
Two things have moved since, and both matter for anyone quoting it.
Thailand released a 2026 edition taking it from 32% to 43%, an eleven-point jump in a year and the largest move anyone in the region has published (AWS and Strand Partners, 2026). No other market has a 2026 edition. I have held the table at 2025 for all six rather than dropping the newer figure in, because that would rank Thailand above Indonesia on a difference of vintage rather than a difference in the world.
Singapore did something stranger. Its May 2026 study stopped publishing a national adoption rate at all. In its place are sector deep dives among SMEs: 75% in financial services, 61% in healthcare, 57% in manufacturing (AWS, May 2026). The most digitally mature market in the region is the one where a single adoption number stopped being worth publishing.
![Horizontal bar chart of AI adoption across Southeast Asia from one survey instrument, 2025: Singapore 48%, Thailand 32%, Indonesia 28%, Malaysia 27%, Philippines 21%, Vietnam 18%. Source: AWS and Strand Partners, Unlocking [Country]'s AI Potential 2025.](/images/blog/sea-ai-adoption-aws-spine.webp)
Citation capsule
The only like-for-like ranking of business AI adoption in Southeast Asia comes from AWS and Strand Partners, who ran the same survey design across six markets in 2025: Singapore 48%, Thailand 32%, Indonesia 28%, Malaysia 27%, the Philippines 21% and Vietnam 18% of businesses consistently using at least one AI tool. Thailand’s 2026 edition subsequently took it to 43%. (AWS and Strand Partners, 2025)
Why does the same country produce two different answers?
Because the two surveys walked into different rooms.
Go back to Vietnam. AWS measured against every active enterprise in the country, a population dominated by very small firms. UOB surveyed owners and senior executives of medium and large enterprises drawn from its own banking relationships, which means every single respondent was already formalised and already banked. One survey asked the whole economy. The other asked the part of the economy that has a relationship manager.
Put like that, 18 against 80 stops being a scandal and starts being arithmetic.
Three variables do this, and none survives into a headline.
The verb
Read across the published studies and you get using, adopted, implemented, deployed, actively exploring or implementing, moved beyond piloting, fully scaled and AI-ready. Eight verbs, eight numbers. “Deployed AI in some capacity” and “fully scaled” describe events roughly eighty percentage points apart.
Who paid
AWS, Microsoft and Cisco all measure markets they sell into. UOB measures its lending book. McKinsey published with Singapore EDB, an investment promotion agency. None of that makes the research dishonest, and several of these methodologies are documented better than most academic work. It does bend the sample in a direction you can predict, and no press release tells you which way.
The denominator
This is the one that surprised me, and it is the reason I now read appendices.
Start with the fair part. AWS and Strand Partners do define their verb, in the same words, in all six country reports: “a business that consistently uses at least one AI tool. This would not include businesses that experimented with AI once or twice, or ran a temporary pilot programme.” That’s tighter than most of what it gets compared against. They also print their denominator, with a named source, in every single report.
Nobody puts those six denominators side by side, so I did.
What “all businesses” means, market by market, inside one study.
| Market | Total business population used | Source cited by the report |
|---|---|---|
| Indonesia | over 65 million | Coordinating Ministry for Economic Affairs |
| Malaysia | 9 million active enterprises | Companies Commission of Malaysia, 2024 |
| Thailand | 1.96 million active enterprises | national registration data, 2024 |
| Philippines | over 1.2 million | Department of Trade and Industry MSME statistics |
| Vietnam | 940,000 active enterprises | Ministry of Planning and Investment, 31 Dec 2024 |
| Singapore | 345,100 enterprises | Singstat, 2023 |
Indonesia’s denominator is 188 times Singapore’s. Their economies are about three times apart.
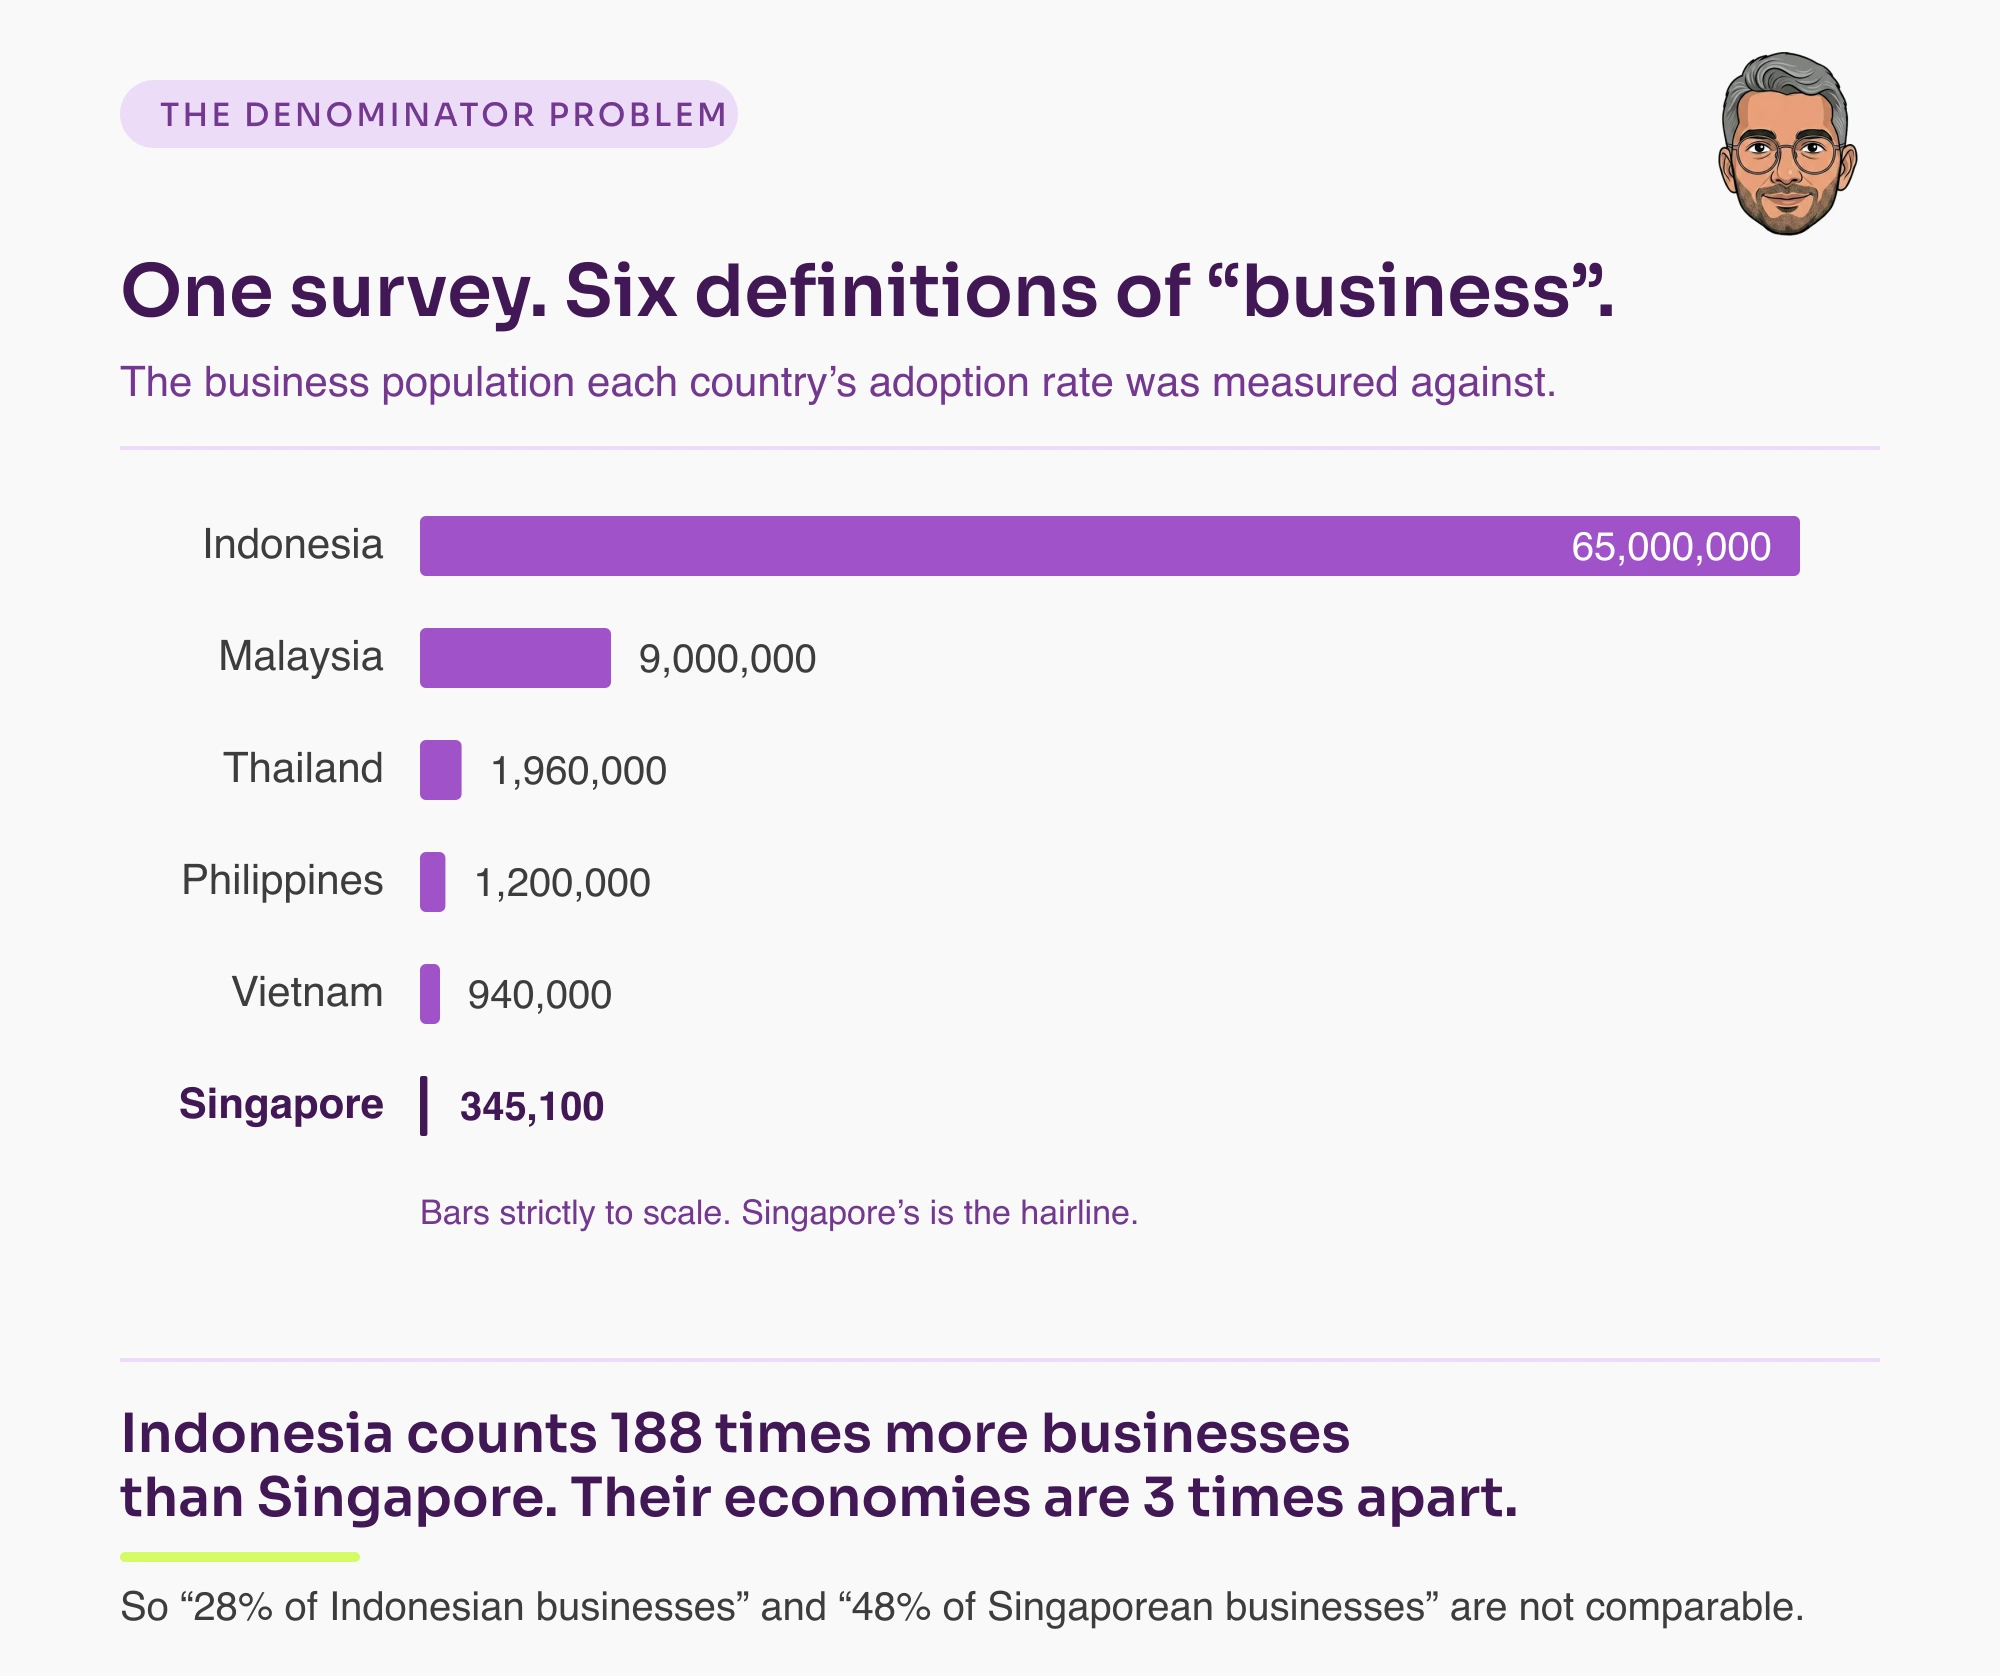
The gap is in how each country keeps its books. Indonesia’s figure runs deep into informal micro-enterprise, because that is what Indonesia counts. Singapore’s covers registered enterprises in a formalised economy, because that is what Singapore counts. The questionnaire is identical, the verb is identical, and “28% of Indonesian businesses” still doesn’t mean what “48% of Singaporean businesses” means, because the word “businesses” has been subcontracted, without comment, to six national statistics agencies counting six different objects.
Every adoption percentage is a fraction, and almost every argument about AI adoption is really an argument about the bottom half of it. If the cleanest comparison in the region cannot survive contact with its own appendix, a chart assembled from six different sources has no chance at all.
I want to be fair about where the failure sits. The reports are good, and considerably better than their coverage. Everything above came out of pages AWS published and almost nobody opens. The collapse happens downstream, in the press release, the trade headline and the LinkedIn carousel, where a number gets cut loose from the sentence that made it mean something.
Citation capsule
Vietnamese business AI adoption is published as 18% by AWS and Strand Partners, whose denominator is Vietnam’s 940,000 active enterprises, and as eight in ten by UOB, who surveyed owners and senior executives of medium and large enterprises from its own banking base. The four-fold gap is a difference of denominator, not of measurement, and neither headline discloses it. (AWS and Strand Partners, 2025; UOB, 2026)
Which Southeast Asian markets are moving fastest?
The Philippines. Or Indonesia. Or Singapore. It depends entirely on which growth measure your chart happens to plot, and this is the trap that catches people who have already got past the first one.
Rank the 2025 set by year-on-year growth rate and you get the Philippines at 50%, Indonesia 47%, Vietnam 39%, Malaysia 35%, Thailand 33%, Singapore 20%. On that slide the Philippines is the region’s momentum story and Singapore is running out of road.
Rank the same six markets by percentage points added and the order rearranges itself: Indonesia +9, Singapore and Thailand +8, Malaysia and the Philippines +7, Vietnam +5. On that slide Singapore is mid-table and perfectly healthy.
Same underlying figures, both charts arithmetically correct, opposite recommendations.
Growth rates flatter whoever started lowest, which is why the Philippines tops one list and not the other. Percentage points flatter whoever already had scale. Singapore moving from 40% to 48% is simultaneously the weakest growth rate in the region and joint second-largest real-world expansion, and I have watched people argue confidently for a market-entry decision using whichever of those two happened to be in front of them.
The dull reading is the safe one. Every market here is growing at double digits, none has plateaued, and the ordering between them is far less stable than any single chart implies.
What does every business survey agree on?
That almost nobody has got past the basics.
This is where the numbers finally start behaving, converging on a transformative share of 8% to 10% in five of the six markets, and the reason is structural. Depth is measured as a share of a market’s own adopters rather than against a national business register. Stop counting companies, start counting what those companies do, and the denominator problem disappears along with the disagreement.
Depth of adoption among businesses that have already adopted AI, 2025 report set.
| Market | Basic | Intermediate | Transformative |
|---|---|---|---|
| Singapore | 65% | 18% | 17% |
| Thailand | 72% | 18% | 10% |
| Malaysia | 73% | 17% | 10% |
| Vietnam | 74% | 17% | 9% |
| Indonesia | 76% | 11% | 10% |
| Philippines | 78% | 11% | 8% |
Read the last column. Five of six markets land between 8% and 10% on the share of adopters doing anything transformative with AI, which the reports define as combining multiple AI tools or models for complex tasks and building custom AI systems. Five separate national samples, drawn from economies at wildly different income levels, agreeing to within two points.
Then check it against an instrument with nothing in common with this one. McKinsey and Singapore EDB, different sample, different method, different sponsor, put 8% of Southeast Asian enterprises at fully scaled AI (McKinsey and Singapore EDB, February 2026). Cisco, surveying only firms with 500 or more staff worldwide, puts 13% in its top readiness tier (Cisco, 2025).
Singapore is the exception in both directions and consistently so: the region’s highest breadth at 48%, and roughly double everyone else’s transformative share at 17%.
The single biggest challenge is integrating AI deeply into our core operating model rather than treating it as a standalone tool. Moving towards an autonomous enterprise requires complex business capability mapping, breaking down legacy data silos, and redesigning workflows so that AI can orchestrate processes seamlessly without disrupting current operations.
That is what the top of the maturity ladder sounds like from the inside. Every item on his list is organisational: capability mapping, data silos, workflow redesign. None of it gets solved by buying something, which is why so few companies get there. And he is sitting in Vietnam, the market this article’s own table ranks last on breadth at 18%, which is a useful reminder that a national adoption figure tells you nothing about the ceiling inside any individual company.
The Thailand warning
This is the finding I would put in front of a board before any other number in this article. Thai adoption climbed from 32% to 43% in a year. Over the same year, the share of Thai adopters stuck at the basic tier went up, from 72% to 74%. The report explains it in one line: new adopters are entering exclusively at the basic tier.
A country can get more AI and less out of it in the same twelve months. Thailand just did. The adoption figure improved for a full year while the share of businesses getting real value from AI went backwards, and every headline built on that figure reported it as unambiguously good news.
The region has spent two years arguing about a breadth number nobody defines the same way, while every survey that bothered to measure depth had already agreed.
What happens when you measure outcomes instead of deployment?
The gap gets much harder to look at.
First, what my data is and is not. My APAC AI adoption survey went to founders and operators across Asia-Pacific. It is self-selected, founder-weighted and skewed towards small teams. Held up as a competing national adoption rate it’d be the weakest row on this page, and I’m not offering it as one.
It asks the one question the vendor studies all skipped: what did the installation return?
Among the respondents who actually use AI, 87% report time savings. 21% report a revenue increase.
Time saved is not money made, and that gap is where most of Southeast Asia currently lives.
Half of my respondents have AI embedded across multiple areas of the business. These are operators who’ve genuinely wired AI into how the work gets done, and five out of six of them can’t point to a revenue line that moved.
I personally think that we are still not using AI to its full potential. There are very limited use cases available to extend the usage in our daily operations. Lack of real ROI is my other concern.
He is describing the gap from inside it. Across the survey as a whole, time savings was the single most commonly reported result of using AI. A revenue increase was among the least.
That is the same finding as the 8% transformative figure, arriving from the opposite direction. AWS gets there by asking how sophisticated the deployment is. I got there by asking what the deployment paid for. Two different questions, the same answer, which is roughly how you tell a real finding from a category somebody drew.
Why my data disagrees with the vendors, and both are right
One result in my data flatly contradicts the vendor studies, and I have come to think both are true.
AWS finds a digital-skills gap almost everywhere it looks. It is the single highest barrier in the Philippines at 57%, Vietnam at 55%, Malaysia at 52%. My respondents put cost first, at 48%, ahead of data privacy at 26% and skills at 25%. Nearly three-quarters of them spend 500 US dollars a month or less on the whole thing.
For a while I assumed one of us had a bad sample. Then the obvious explanation surfaced. A vendor-sponsored survey of the formal business population finds a skills gap, because a company with 200 staff experiences the constraint as hiring. An independent survey of founders running small teams finds a pricing gap, because a company with nine staff experiences the same constraint as a monthly bill it can’t justify. Both populations are real. They’re not the same population, and the fix for one is useless to the other.
Which is this article’s own argument turned on its own data. It seemed dishonest to spend this long on other people’s denominators and then hand mine a free pass.
Citation capsule
Southeast Asian AI adoption surveys disagree on breadth but converge on depth. In the 2025 AWS and Strand Partners report set, the share of AI-adopting businesses at a transformative level of use sits between 8% and 10% in five of six markets, with Singapore the outlier at 17%. McKinsey and Singapore EDB independently put 8% of regional enterprises at fully scaled AI. An independent survey of Asia-Pacific founders found the outcome equivalent: among those who actually use AI, 87% report time savings and 21% report a revenue increase. (McKinsey and Singapore EDB, 2026; APAC AI Adoption Survey, 2026)
If you want the practical version of getting past basic use, I have written separately about what AI agents actually do in a business and seven automations small businesses in Southeast Asia can run now.
AI adoption by country: why the famous rankings measure people, not companies
Everything so far has counted companies. The rankings that actually circulate count people, and they put the region in almost exactly the opposite order.
You’ve seen the map even if you don’t remember where. Microsoft’s AI Economy Institute publishes the most-shared AI adoption statistic in the world, and every “AI adoption by country” graphic doing the rounds traces back to it. It measures the share of people aged 15 to 64 who used a generative AI product in the period, from aggregated Microsoft telemetry adjusted for device market share, internet penetration and population (Microsoft AI Economy Institute, Q1 2026).
It measures citizens. It has nothing to do with companies. Put the two side by side and the region turns inside out.
Population adoption against business adoption. Different denominators, different questions.
| Economy | People using AI (Microsoft, Q1 2026) | Businesses using AI (AWS/Strand, 2025) |
|---|---|---|
| Singapore | 63.4%, second globally | 48%, highest in region |
| Vietnam | 26.5% | 18%, lowest in region |
| Malaysia | 21.8% | 27% |
| Philippines | 20.1% | 21% |
| Indonesia | 14.1% | 28% |
| Thailand | 12.4%, lowest of the six surveyed | 32%, and 43% in its 2026 edition |
| Myanmar | 10.0% | no business survey |
| Laos | 7.8% | no business survey |
| Cambodia | 5.7% | no business survey |
Vietnam has the second-highest population adoption in Southeast Asia and the lowest business adoption. Thailand and Indonesia are the mirror image, near the bottom on people and near the top on companies. Two rankings from the same year putting the region in opposite orders, and I would defend every source on both.
There is a mechanism, and it comes from Google’s own product data. In five of the six measured markets, most Gemini prompts arrive from a mobile device, from 66% in Vietnam up to 82% in Indonesia. Singapore is the only market in the region where most prompts, 58%, come from a computer.
That split explains a lot. In a mobile-first market, personal AI use and workplace AI use are close to separate activities. One happens on a phone during a commute, at nobody’s expense and with nobody’s approval. The other needs a desktop, a procurement decision, an IT policy and someone willing to sign. A country can have millions of people using AI daily and very few companies using AI at all, and there’s nothing contradictory about it. Singapore is the only desktop-majority market in the region and the only one where both numbers are high. I doubt that’s a coincidence.
Here is what that costs in practice. A map showing Singapore at 63% and Thailand at 12% measures consumer habit. A chart showing Thailand at 43% and Vietnam at 18% measures corporate deployment. If you’re choosing where to hire or where to open an office, those point in different directions, and almost none of the pages reproducing them tell you which one you’re holding.
Citation capsule
The AI adoption rankings by country that circulate most widely measure population, not enterprises. Microsoft’s AI Economy Institute defines diffusion as the share of people aged 15 to 64 who used a generative AI product in the period, from adjusted telemetry, and ranks Singapore second globally at 63.4% with Thailand at 12.4%. On business adoption the order inverts: Vietnam ranks second in the region on population adoption and last on business adoption. (Microsoft AI Economy Institute, 2026)
Two cautions on that number
Both of these matter more than the figure itself.
The vintage moves under you. The Q1 2026 report gives UAE 70.1%, Singapore 63.4% and the United States 31.3%. The January 2026 report, covering the second half of 2025, gives UAE 64.0%, Singapore 60.9% and the United States 28.3% (Microsoft, 2026). Widely-shared restatements mix the two without saying so. Date whichever one you quote.
And the definition drifts in retelling. Popular versions describe this as people who used AI for at least 90 minutes a month. Microsoft’s own definition carries no time threshold at all. The most-shared version of the world’s most-shared AI statistic describes the metric differently from the report it came from, which is either funny or bleak depending on the day. Microsoft, to its credit, gets there first: “No single metric is perfect, and this one is no exception.”
When the denominator is the product itself
There is a third category of number, and it is the one most likely to fool a careful reader, because it looks exactly like adoption data.
Google’s Gemini Report: Southeast Asia 2026 contains no adoption rate for any country. Not one. Every figure in it is a growth rate, a share of prompts, a share of its own user base, or a rank (Google, 2026). The denominator is always Gemini.
“Gemini users in Southeast Asia more than doubled in twelve months” is a sentence that feels like it tells you something about penetration. Doubled from what? The report doesn’t say, and it doesn’t have to, because it isn’t that kind of document.
Used for what it can support, it is genuinely valuable. The device split above comes from it and nothing else provides that. So does the language data: close to 70% of prompts in the region are written in local languages, rising to 89% in Vietnam. Those are real findings that only Google could produce.
Used as evidence of adoption, it should carry a label. It discloses no sample size and no methodology beyond Google internal data, and it exists to sell Gemini. Given that this whole article is an argument about disclosing denominators, quoting an undisclosed one without saying so would be a poor look.
One cross-check earns its place. Google says Singapore has the highest per-capita Gemini adoption in the world. Microsoft independently ranks Singapore second globally on population diffusion. Two unrelated instruments, one answer. Of everything on this page, Singapore’s exceptionalism is the finding I would bet on surviving the next round of reports.
Four Southeast Asian countries nobody has asked
Six of the ten ASEAN economies have a national business AI survey. Brunei, Cambodia, Laos and Myanmar have none at all, and I mean none: not even an old or partial one to update.
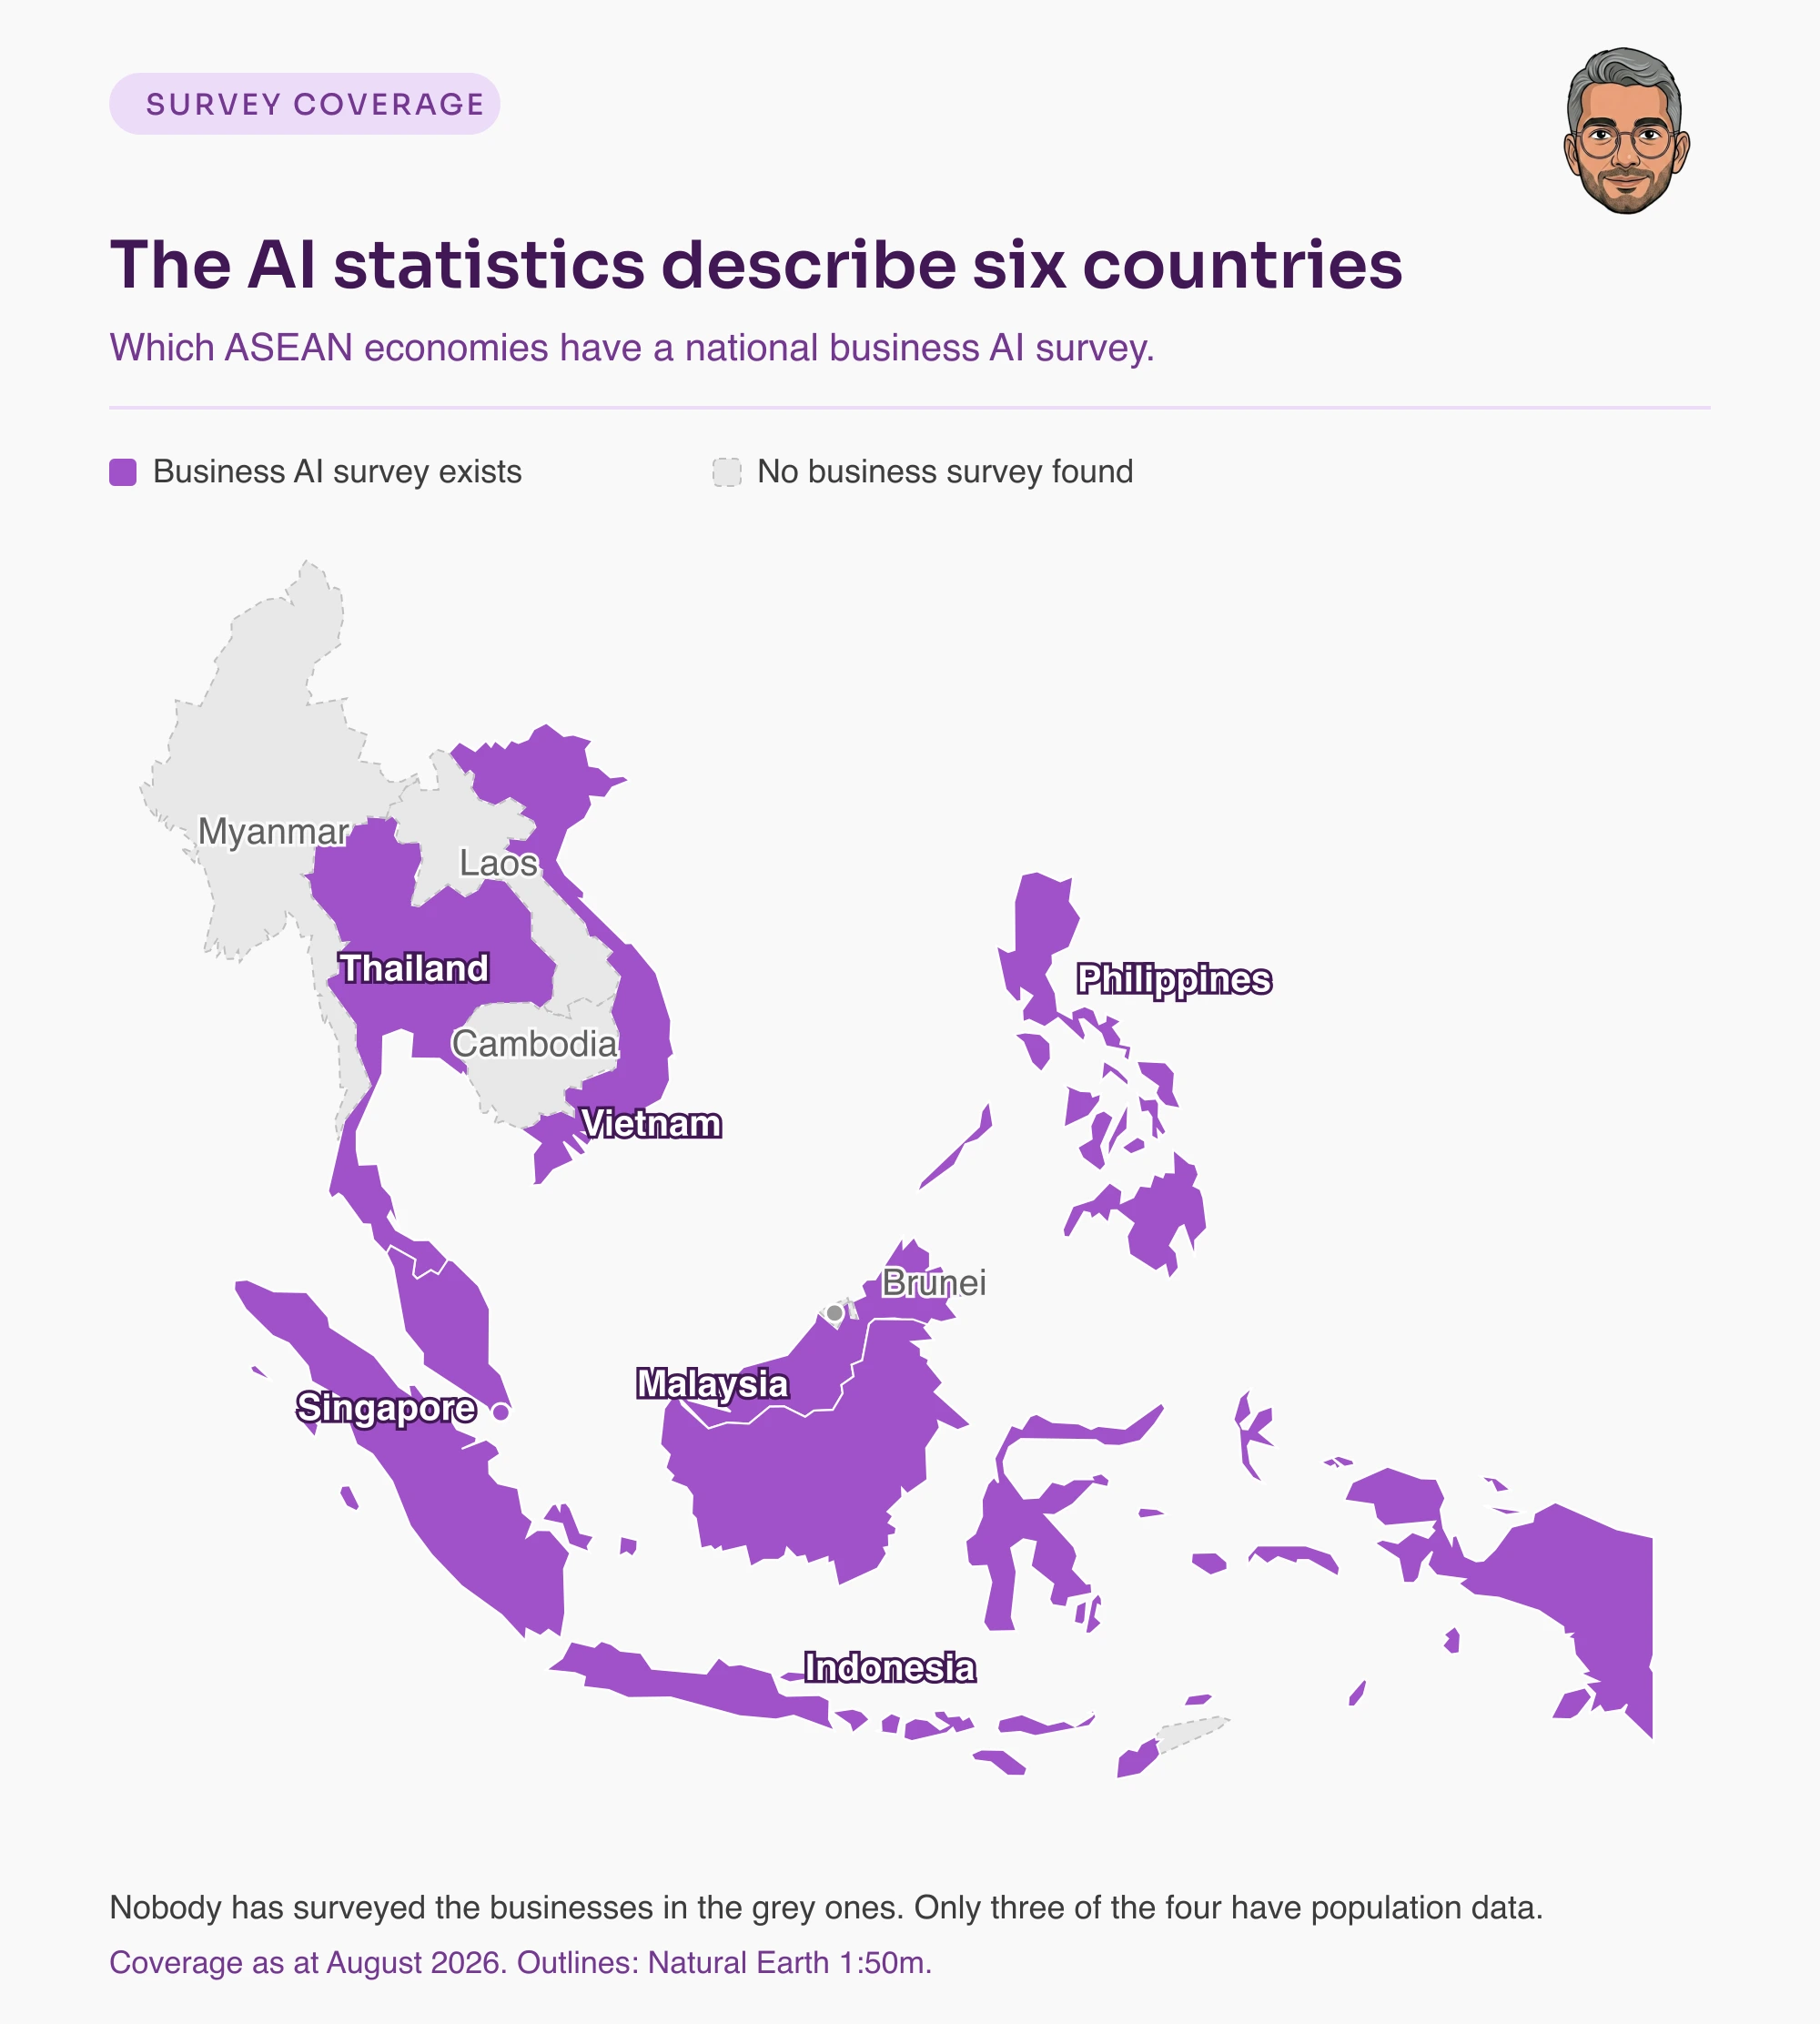
What does exist makes the hole sharper. Microsoft’s population telemetry reaches three of the four: Myanmar 10.0%, Laos 7.8%, Cambodia 5.7%. Only Brunei appears in neither dataset. So we know roughly what share of Cambodians use AI. Nobody has ever asked a Cambodian business anything.
That asymmetry follows the money exactly. Population diffusion can be computed from telemetry a vendor already holds, at no incremental cost. A business survey needs a sampling frame, fieldwork, and somebody with a commercial reason to fund it. AWS has cloud regions in Singapore, Indonesia, Malaysia and Thailand. UOB has retail banking across five markets. The map of who has been measured is very close to the map of who has been sold to.
So when a report says “Southeast Asia”, ask whether it means the region or the six countries someone paid to look at.
What should a board actually do about shallow adoption?
Everything up to here is diagnosis. Six markets, four different kinds of number, and one finding that survives all of them: adoption is broad, depth is rare, and the published figures are too unstable to steer by.
That leaves a director with a practical problem, because you can’t govern your way to a better national statistic. The statistic was never measuring your company in the first place. What a board can govern is whether its own organisation ends up in the 8% or the 74%, and until recently there was not much written for the person who has to ask that question out loud in a meeting.
Which is why the timing of the Singapore Institute of Directors’ AI Guide for Boards in Singapore, published in 2026, is worth a section of its own. It treats shallow adoption as a board problem rather than a technology one, which after a fortnight in this data felt like someone opening a window.
I’m an SID Accredited Director, so weigh that as you like. I had no hand in writing it and won’t reproduce its roadmap or checklists here. Four things in how it is built line up with what the regional evidence shows.
It runs conformance and performance through one lens
Risk management and strategic growth as a single board responsibility, rather than two committees that meet separately and disagree in private. In a region where breadth is high and value capture is low, that is the correct instinct. Governing the risk without governing the return produces precisely the pattern every survey in this article keeps finding.
It names pilot purgatory
The guide tackles AI work that never leaves the pilot stage head-on. Set that against 8% fully scaled and the aim is unusually well judged. Most governance material braces for risks that haven’t happened yet. This one addresses a failure mode that’s already the regional default.
It separates best-in-class from only-in-class
Incremental productivity against genuinely new business models. That is the distinction AWS measures in every country and finds missing in three-quarters of adopters, and boards have mostly lacked the words for it. Shared vocabulary is most of what a board needs in order to ask a useful question.
It scales oversight to impact
Proportionate, risk-tiered governance rather than one uniform process applied to everything, which is what makes it usable by a 40-person company and not only a listed one. In a region whose business population is overwhelmingly small, that is not a detail. Directors who want to build the underlying literacy first will find it in my guide to AI fluency for board directors.
Why a depth instrument was needed is answered, uncomfortably, by AWS’s own Singapore study. Among Singapore SMEs that have adopted AI, only around 30% have a clearly defined person responsible for overseeing whether the AI is right. Six in ten would face significant or moderate disruption if that person left. About one in ten say their AI work would stop altogether. AWS’s own reading is that the ability to question an AI output “may still depend too heavily on individual confidence rather than a clear channel for raising concerns” (AWS, May 2026).
In other words, in the region’s most mature market, AI accountability is often one person who hasn’t been told that’s their job, and who could resign on Friday.
Then the guidance problem. Of the SMEs that found industry-specific AI guidance at all, around two-thirds had to adapt it significantly before it was usable, and only a minority found it directly applicable: 20% in healthcare, 17% in financial services, 13% in manufacturing. Guidance written for a sector in the abstract does not survive contact with a particular business. Guidance written for a role has a better chance, and a board is a role.
The biggest challenge is turning AI from a powerful tool into a system-level solution. This requires not only technical integration with hospital infrastructure, but also alignment with clinical workflows and reimbursement models.
Reimbursement models. No AI vendor’s deployment guide has a section on reimbursement models, and no generic sector playbook could, because the answer differs by country, by insurer and by procedure. That is the adaptation tax those Singapore SMEs were describing, expressed by someone paying it.
For the accountability structures underneath all this, see my guide to AI agent governance for Singapore boards.
Does your board need to get current on AI governance quickly, without a stock deck? I run customised board and C-suite sessions built around your actual deployments, your sector and your regulatory exposure. As an SID Accredited Director who builds and runs these systems day to day, I can brief a board from both sides of the table. Get in touch.
Does the guide travel across ASEAN?
The architecture travels. The statutory layer does not.
A board in Ho Chi Minh City or Bangkok can’t lift a Singapore guide wholesale, because it’s built on Singapore’s law. What does travel is the shape of it. Treat risk and growth as one job. Tier your oversight by how much damage a system could do. Name who is answerable, and make that name hard to pass on. Set how often the board looks. What stays behind is PDPA, MAS guidance and AI Verify.
That split matters more each quarter, because ASEAN is drifting apart on AI rules rather than together. Seven of the ten member states now have an AI governance policy: Brunei, Indonesia, Malaysia, the Philippines, Singapore, Thailand and Vietnam. Brunei was the latest to move, releasing its guide in late 2025. Cambodia, Laos and Myanmar are still writing theirs, and Timor-Leste, the newest member, has a digital strategy that doesn’t yet mention AI at all (ISEAS Perspective 2026/13, 2026).
And the seven have not moved in step. Vietnam passed a risk-based law, in force from March 2026, with fewer risk tiers than the EU model and a test based on impact rather than on use case. Thailand drafted its law on the EU template, let it sit for two years, and is now reworking it to fit local circumstances. Indonesia wants each sector to define its own high-risk uses. Singapore, Malaysia and Brunei have stayed voluntary. If your regional compliance plan assumes these converge, it rests on a forecast rather than a fact.
The seven pillars that do travel
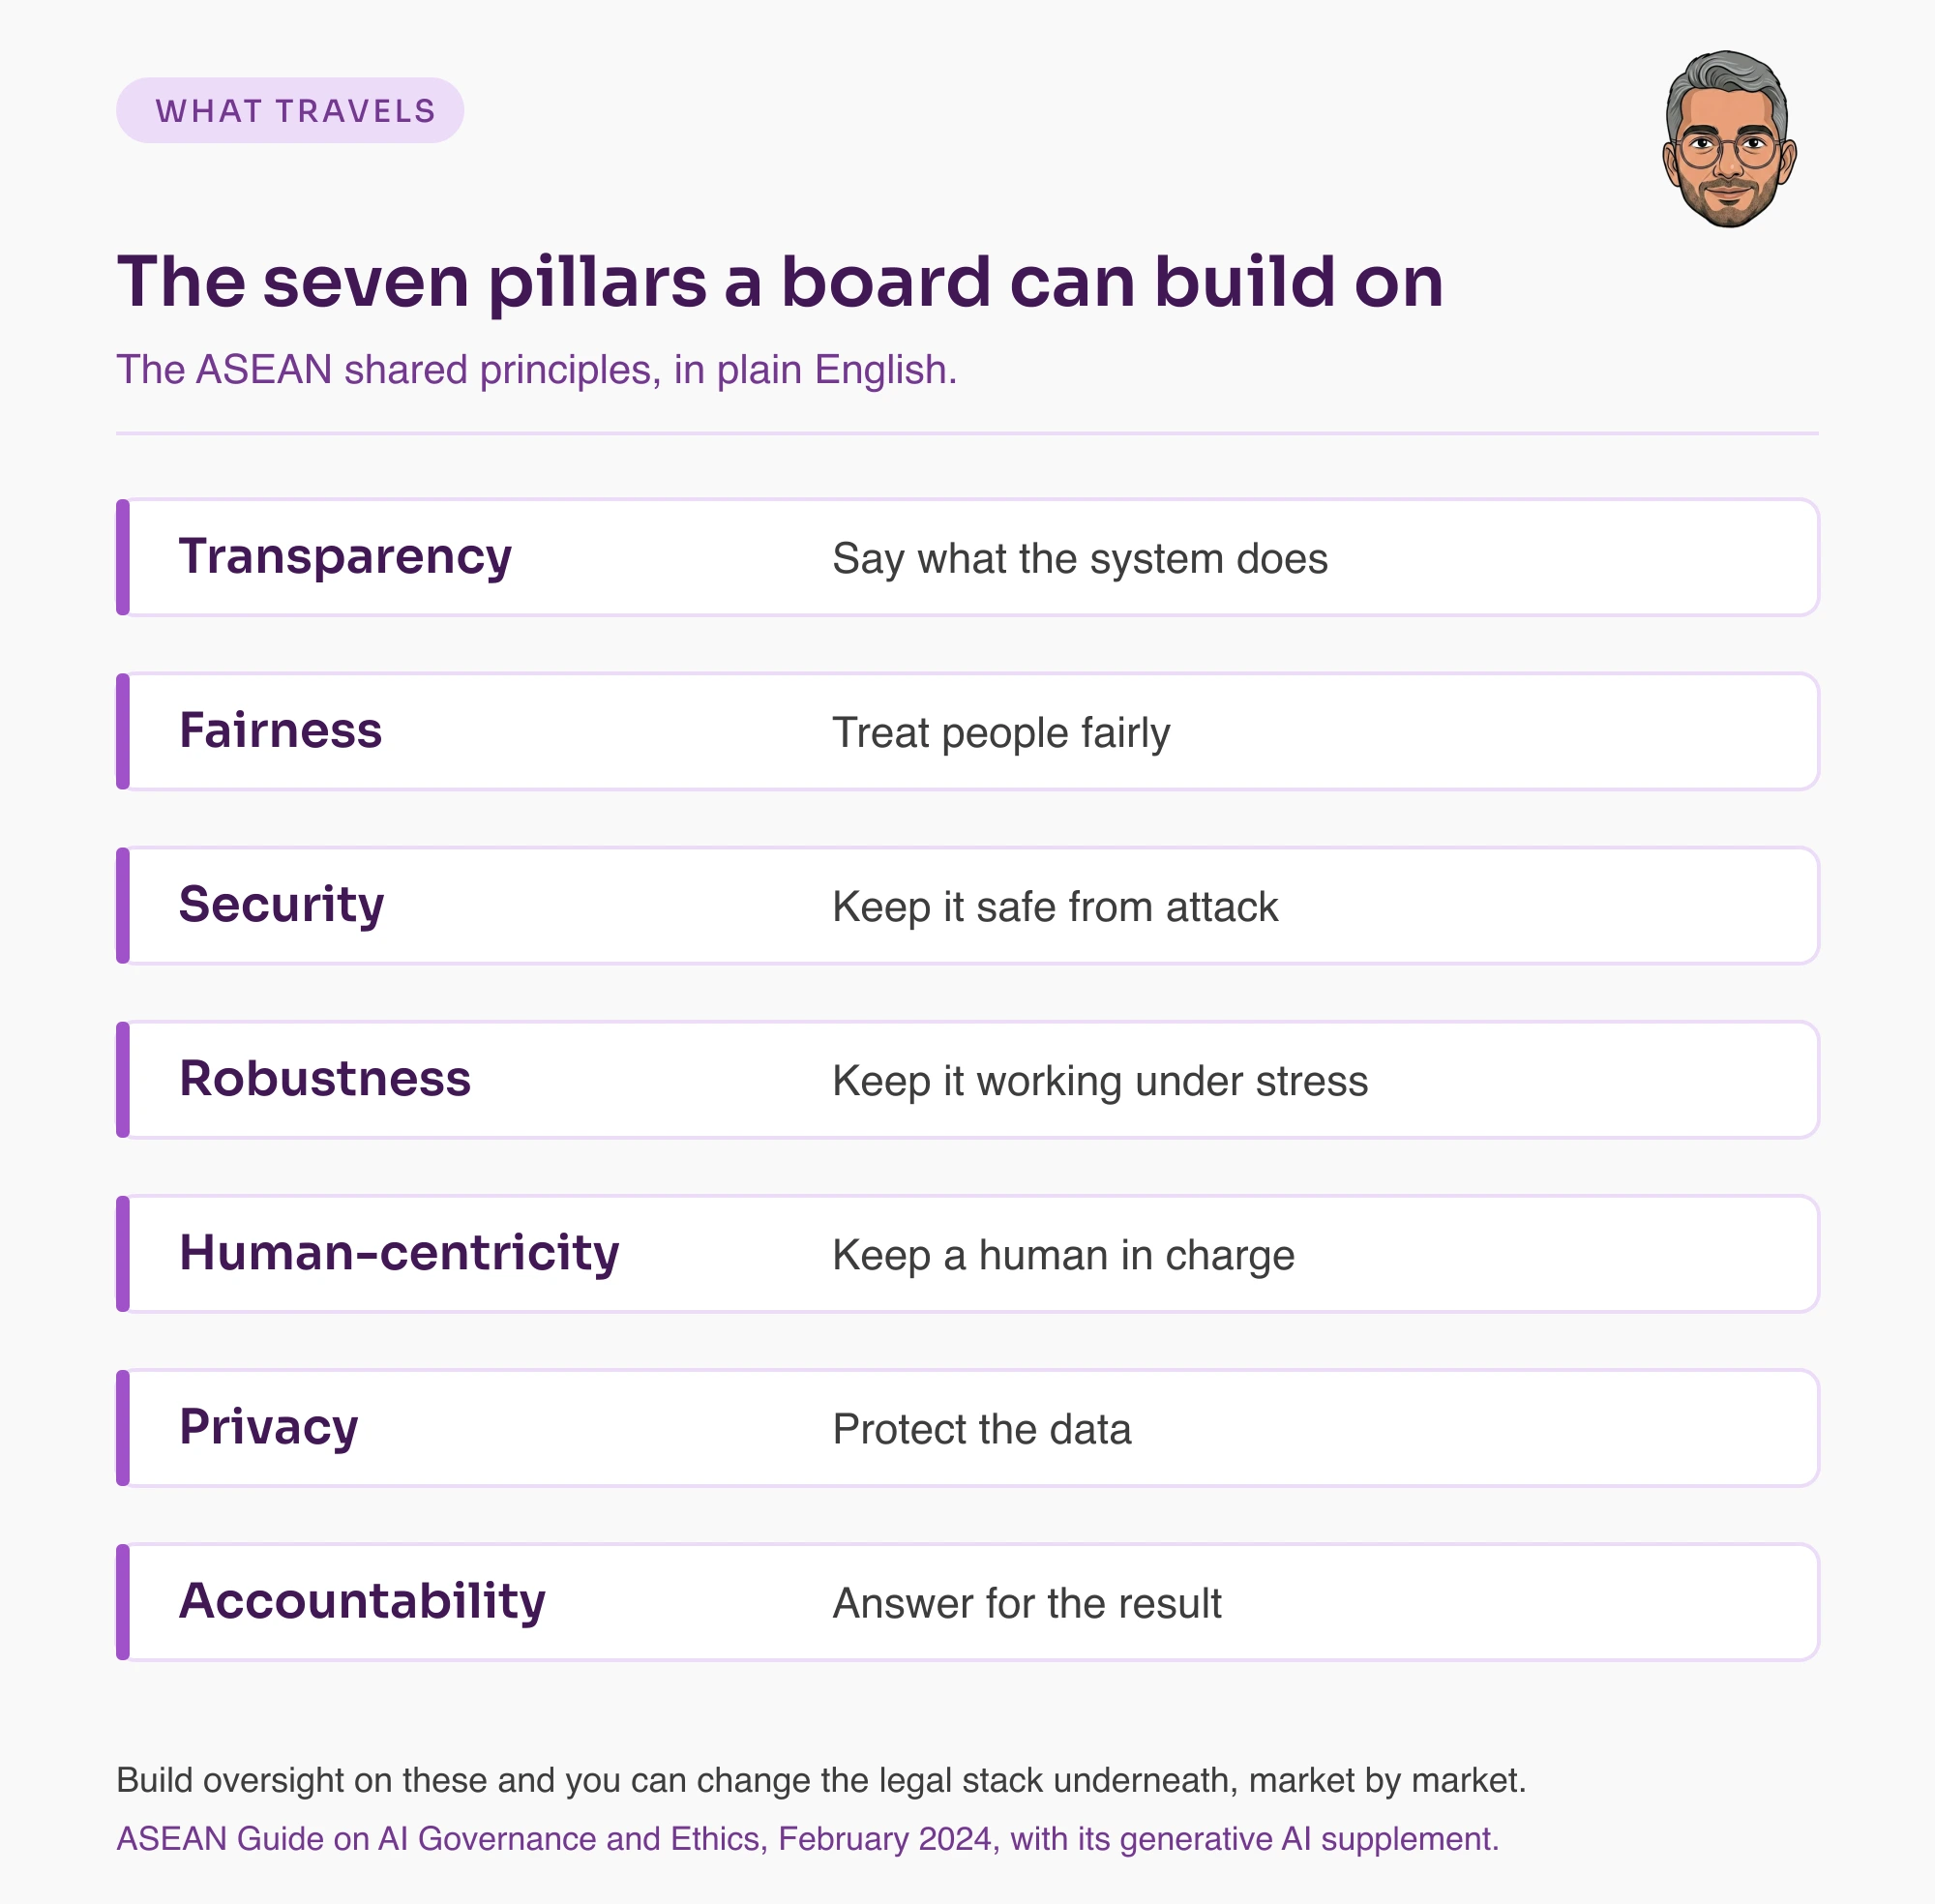
There is one common reference point. The ASEAN Guide on AI Governance and Ethics, published in February 2024 with a generative AI supplement the year after, sets out seven shared pillars: transparency, fairness, security, robustness, human-centricity, privacy and accountability. In plainer terms: say what the system does, treat people fairly, keep it safe and working, keep a human in charge, protect the data, and answer for the result. Singapore’s AI Verify maps to EU, G7, OECD and US principles, and that mapping is what makes the model portable. Build your oversight on those seven and you can change the legal stack underneath it market by market without starting again.
One last thing about the coverage gap, because it compounds. Cambodia, Laos and Myanmar have neither a national AI policy nor a business AI survey. No evidence and no rules, in exactly the markets least able to absorb the cost of getting this wrong.
Citation capsule
ASEAN AI governance is diverging rather than converging. Seven of ten member states have AI governance policies in place: Brunei, Indonesia, Malaysia, the Philippines, Singapore, Thailand and Vietnam. Vietnam has adopted a risk-based law effective March 2026, Thailand is redrafting an EU-template law to fit local circumstances, Indonesia has proposed a sectoral framework, and Singapore, Malaysia and Brunei run voluntary frameworks. Cambodia, Laos and Myanmar are still developing national AI strategies, and Timor-Leste’s digital strategy does not yet cover AI. (ISEAS Perspective 2026/13, 2026)
Six questions to ask of any AI adoption statistic
This is the part I’d keep if you kept nothing else. Every number in this article passed or failed on these six, and they take about thirty seconds to run.
- Whose denominator? Every registered business, medium and large enterprises only, one bank’s customers, firms with 500 or more staff, or people rather than firms?
- Which verb? Using, adopted, implemented, deployed, beyond piloting, fully scaled, AI-ready? These are not synonyms, and the spread between the loosest and the strictest is more than eighty points.
- Who paid, and what do they sell? Not a reason to bin the data, but a reason to know which way it leans.
- What vintage? Plenty of figures circulating as 2026 numbers come from 2025 fieldwork, and at these growth rates a year is a long time.
- Is there a denominator at all, or only a growth rate? “Doubled in twelve months” is not an adoption rate. Doubled from what?
- Is there a depth number? A report that gives you breadth and no depth has told you nothing about whether any value was captured.
If you sit on a board or an exco and someone drops an AI adoption chart into the pack, those six questions are the whole review. In my experience the second one does more damage than the other five combined, because the verb is the thing that never survives the trip from methodology note to slide.
And if you take one number away from all of this, make it the pair from my own survey. 87% saving time. 21% making money. Everything else on this page is an argument about how to count. That one is an argument about what to do next.
All four graphics above as high-resolution PNGs, plus a 16:9 slide version of each with its data source printed on the image, so you can drop them straight into a board pack. Regenerated from the source data every time this article is updated.
Get the chart pack
Frequently Asked Questions
What is an AI adoption rate?
An AI adoption rate is the percentage of a specific population, such as registered businesses or working-age adults, reported to be doing a specific thing with AI within a specific timeframe. Move any of those three, the population, the activity or the period, and the figure can shift by tens of points without anyone being wrong.
What is the AI adoption rate in Southeast Asia?
There is no single rate, and any source quoting one has picked a denominator without telling you. On the only survey design applied identically across the region, 2025 business adoption runs from 18% in Vietnam to 48% in Singapore, with Thailand at 32%, Indonesia 28%, Malaysia 27% and the Philippines 21%. Thailand’s 2026 edition takes it to 43%. Surveys restricted to medium and large enterprises report far higher figures for the same countries, up to eight in ten in Vietnam.
Why do AI adoption statistics for Southeast Asia disagree so much?
Three variables, none of which appears in a headline. The denominator differs, since some surveys count every registered business and others count only large firms or one bank’s customers. The verb differs, ranging from using AI to fully scaled. And the sponsor differs, with most major studies funded by companies selling into the markets they measure. Even inside one survey run identically in six markets, the business population it measures against ranges from 345,100 in Singapore to over 65 million in Indonesia.
Which Southeast Asian country has the highest AI adoption rate?
Singapore, on both measures, and it is the only market where that is true. On population adoption it ranks second globally at 63.4% of working-age people using generative AI. On business adoption it led the 2025 regional set at 48%, with Vietnam lowest at 18%. Below Singapore the two measures diverge sharply: Vietnam ranks second in the region on people and last on companies, while Thailand and Indonesia are near the bottom on people and near the top on companies.
What is the AI adoption rate in Vietnam?
Both 18% and eight in ten are current answers. AWS and Strand Partners measure 18% against all of Vietnam’s 940,000 active enterprises, a population dominated by very small firms. UOB reports eight in ten among medium and large enterprises drawn from its own banking base. The four-fold gap is the denominator, not the measurement.
How many businesses in Indonesia use AI?
Around 28% in 2025, up from 19% the year before, on the AWS and Strand Partners survey. Read the denominator before comparing it: that percentage is measured against over 65 million businesses, a count that runs deep into informal micro-enterprise, which is why 28% here means more than 18 million AI-adopting firms.
What is the AI adoption rate in Thailand?
32% of businesses in the 2025 AWS and Strand Partners survey, rising to 43% in its 2026 edition, the largest jump in the region. The caveat matters as much as the number: over the same year, the share of Thai adopters stuck at basic use rose from 72% to 74%, because new adopters are entering exclusively at the basic tier.
Is AI actually making money for businesses in Southeast Asia?
For a minority of them so far. An independent survey of Asia-Pacific founders and operators found that, among respondents who actually use AI, 87% reported time savings but only 21% reported a revenue increase, despite half having AI embedded across multiple areas of the business. That matches the vendor research from the other direction: only 8% to 10% of adopters in most Southeast Asian markets have reached a transformative level of use.
Is the SID AI Guide for Boards useful outside Singapore?
Its architecture is portable, its statutory layer is not. The conformance and performance lens, risk tiering by impact, defined accountability roles and board oversight cadence all transfer to a board in Jakarta or Bangkok. The specific legal references, PDPA, MAS guidance and AI Verify, do not. Because AI Verify is aligned to EU, G7, OECD and US principles, a board can keep the structure and swap the legal stack underneath it.
Which ASEAN countries have AI governance policies?
Seven of ten. Brunei, Indonesia, Malaysia, the Philippines, Singapore, Thailand and Vietnam have AI governance policies in place. Cambodia, Laos and Myanmar are still developing national strategies, and Timor-Leste, the newest member, has a digital strategy that does not yet cover AI. The seven that have moved have taken different approaches, from Vietnam’s risk-based law effective March 2026 to Indonesia’s proposed sectoral framework and the voluntary frameworks used in Singapore, Malaysia and Brunei.
Sources and methodology note
Every AWS figure here was read from the full country report, not from a press release. AWS and Strand Partners publish all of them on one site, a page and a downloadable report per market: Singapore · Thailand · Indonesia · Malaysia · the Philippines · Vietnam. Worth knowing, because that site is barely linked from any of the coverage, and the reports carry the methodology, the denominators and the depth breakdowns that the press releases leave out.
Several things on this page exist only in those reports. Singapore’s 48% national adoption rate and its depth split appear in no press release I could find. Neither does the business population any market is measured against, which is the appendix figure the whole comparison turns on. Malaysia and Thailand have no AWS press release in English at all. Working from coverage alone, this article would have been missing its highest-adoption market and its central argument.
One figure from the AWS Singapore study that circulates in secondary coverage is deliberately not reproduced: its escalation-process statistic is written in a way that contradicts the sentence immediately after it, so I have used the study’s own qualitative framing rather than pick a direction. Its “two-thirds had to adapt industry guidance” figure appears here only with its real denominator, businesses that found such guidance in the first place rather than all businesses, a distinction most restatements drop.
Figures I could not trace to a primary source were cut rather than softened with “reportedly”. That includes several regional splits, national digital-economy figures and vendor surveys that circulate widely on this topic. Where a number is missing here and present elsewhere, that is usually why.
The APAC AI Adoption Survey is my own, run across Asia-Pacific markets and published in full at /apac-ai-adoption-2026/, where the sample size, composition and limitations are all stated. The three respondents quoted here ticked the survey’s consent question, which asked whether we could publish their quote alongside their name. That is the limit of what is attributed to them: a quote, a name, a role, a sector and a country. Their answers to every other question stay in the aggregate, where they were given. Quotes are published for the first time on this page rather than reused from the report, and wording has been lightly corrected for grammar and British spelling, as it is on the report itself, and in one case trimmed of a closing sentence, never altered for meaning. It is founder-weighted, skewed towards early-stage and small teams, and self-selected. It appears here as an outcome reading, never as a competing adoption rate.